Chart.js-compatible chart rendering for .NET — straight to PNG, no browser required.
ChartCS ports Chart.js semantics (option names, defaults, scale math, spline math, colors) to C# and rasterizes charts server-side with SkiaSharp. If you know Chart.js, you already know ChartCS — it even accepts your existing Chart.js JSON configs.


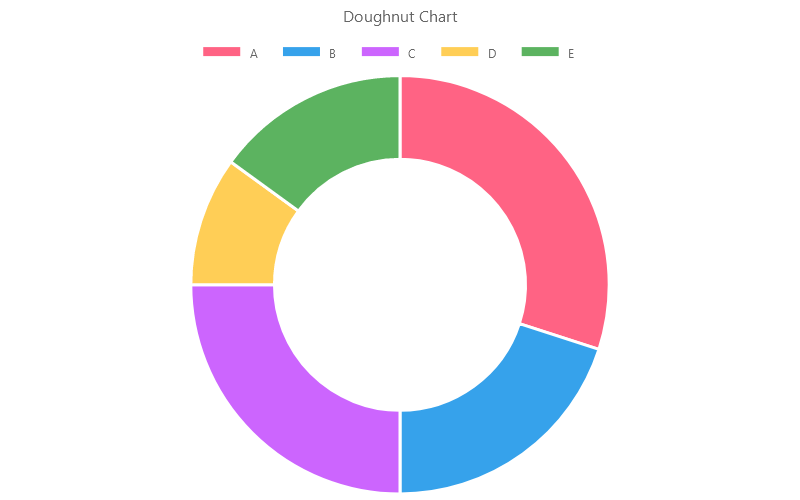
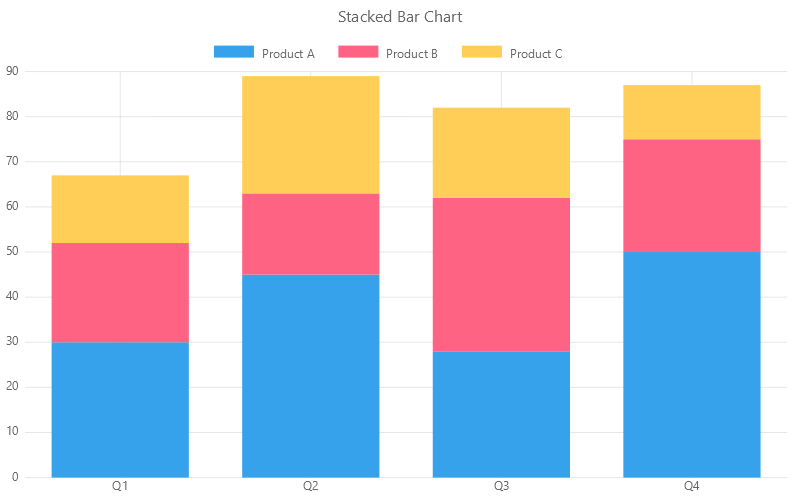
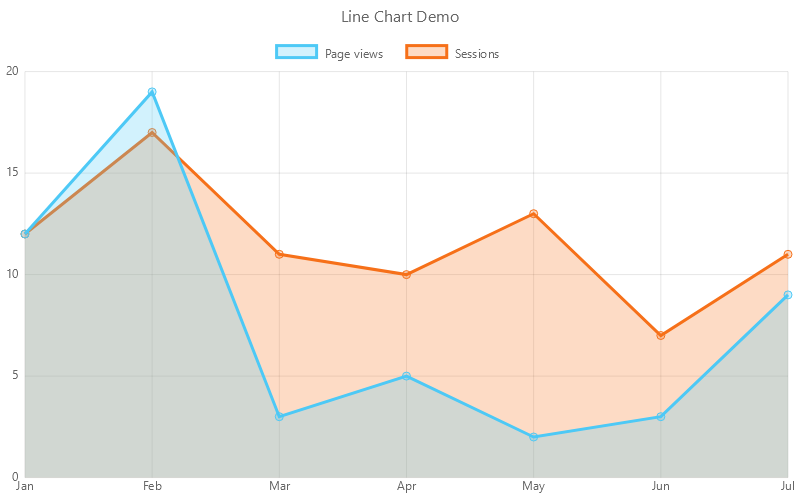
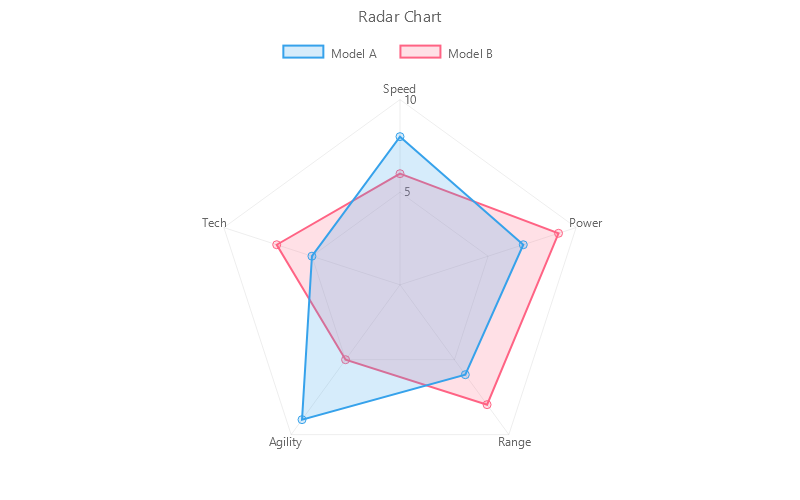
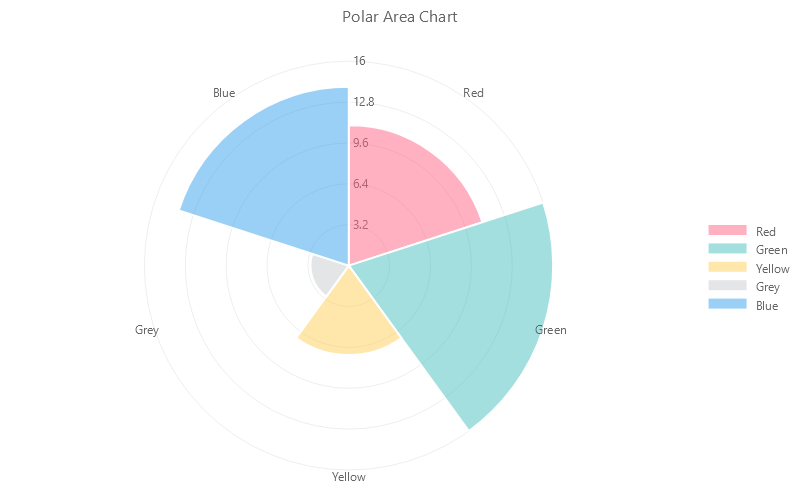
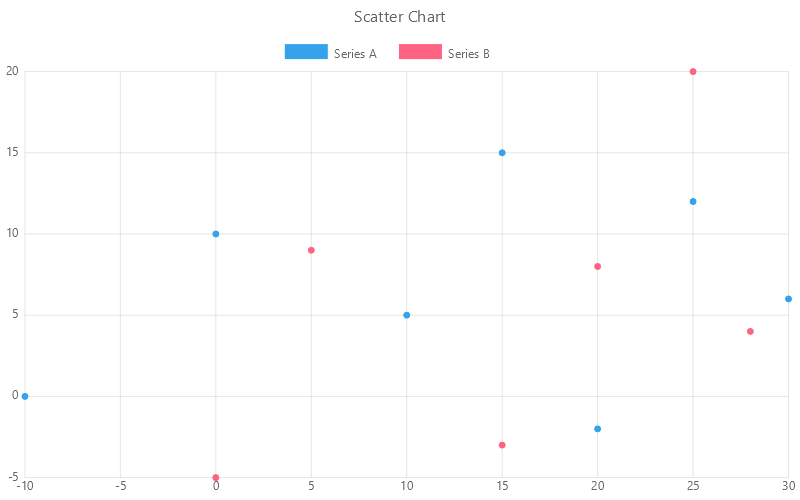
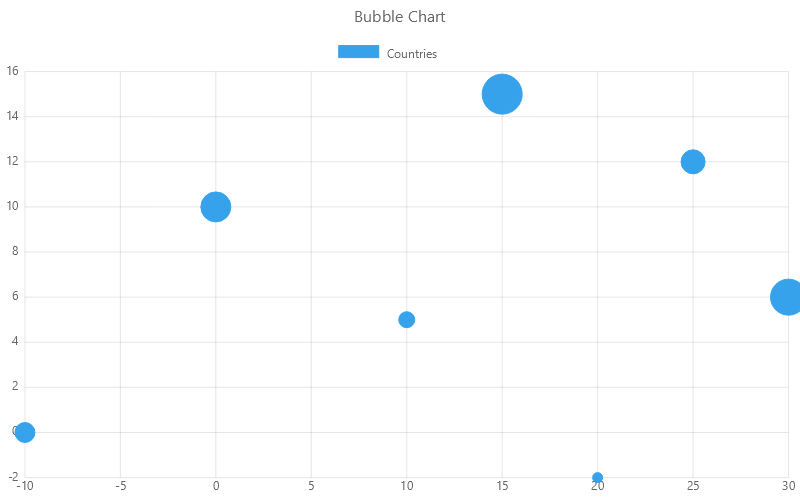
- 🎯 8 chart types — bar (grouped & stacked), line, pie, doughnut, radar, polar area, scatter, bubble
- 🧩 Chart.js JSON in, PNG out — feed it real Chart.js configuration JSON (
type/data/options) - 🧮 Faithful to Chart.js — nice-number ticks,
beginAtZero/suggestedMin/maxsemantics, bezier & monotone interpolation,spanGaps, stacking, legends per dataset or per slice - 🖥️ Server-side & headless — SkiaSharp rendering; no Chromium, no Node, no JS engine
- 🏗️ Three small packages —
ChartCS.Core(model + JSON),ChartCS.SkiaSharp(renderer),ChartCS.Fluent(builder API)
dotnet add package ChartCS.SkiaSharp   # renderer (pulls in ChartCS.Core)
dotnet add package ChartCS.Fluent      # optional fluent builder
Linux note: SkiaSharp ships Windows/macOS natives in-box. On Linux (servers, Docker, CI) also add
SkiaSharp.NativeAssets.Linux.
using ChartCS.Core;
using ChartCS.SkiaSharp;

var config = new ChartConfig
{
    Type = ChartType.Bar,
    Data = new ChartData
    {
        Labels = ["Jan", "Feb", "Mar", "Apr", "May", "Jun", "Jul"],
        Datasets =
        [
            new() { Label = "Sales 2024", Data = [65, 59, 80, 81, 56, 55, 72], BackgroundColors = ["#4dc9f6"], BorderWidth = 1 },
            new() { Label = "Sales 2025", Data = [28, 48, 40, 19, 86, 27, 90], BackgroundColors = ["#f67019"], BorderWidth = 1 }
        ]
    },
    Options = new ChartOptions
    {
        Plugins = new ChartPlugins { Title = new ChartTitle { Display = true, Text = "Monthly Bar Chart" } },
        Scales = new Scales { Y = new ScaleOptions { BeginAtZero = true } }
    }
};

ChartRenderer.RenderToPngFile(config, "bar.png", 800, 500);
// or: byte[] png = ChartRenderer.RenderToPng(config, 800, 500);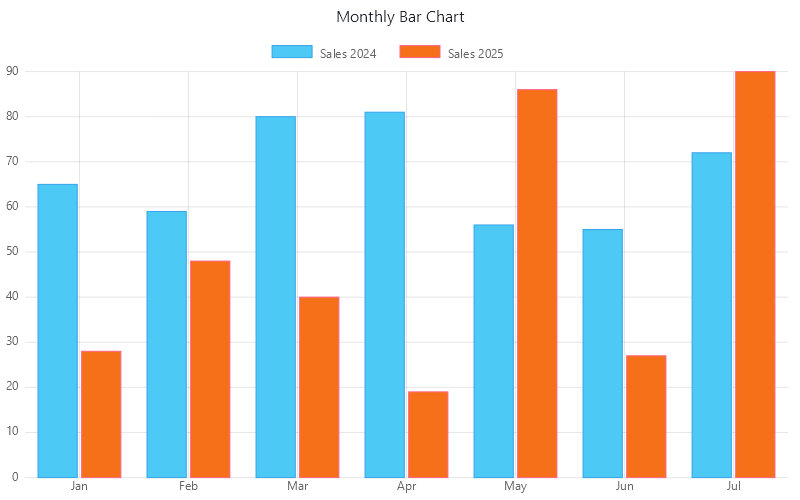
Any Chart.js-format configuration deserializes as-is — singular/plural color options, {x,y,r} point data,
tension: true, string-or-array colors and numeric paddings all bind the way Chart.js reads them.
using ChartCS.Core;
using ChartCS.SkiaSharp;

var config = ChartJsonOptions.Deserialize("""
{
  "type": "line",
  "data": {
    "labels": ["Sprint 1", "Sprint 2", "Sprint 3"],
    "datasets": [
      {
        "label": "Completion Rate (%)",
        "data": [80, 89, 93],
        "borderColor": "#36a2eb",
        "backgroundColor": "rgba(54, 162, 235, 0.16)",
        "borderWidth": 3,
        "fill": true,
        "tension": 0.3,
        "pointRadius": 4
      },
      {
        "label": "Commitment Target",
        "data": [85, 85, 85],
        "borderColor": "#f67019",
        "borderWidth": 2,
        "pointRadius": 0
      }
    ]
  },
  "options": {
    "plugins": { "title": { "display": true, "text": "Sprint Completion Rate" } },
    "scales": { "y": { "beginAtZero": true, "max": 100 } }
  }
}
""");

ChartRenderer.RenderToPngFile(config, "sprint.png", 800, 500);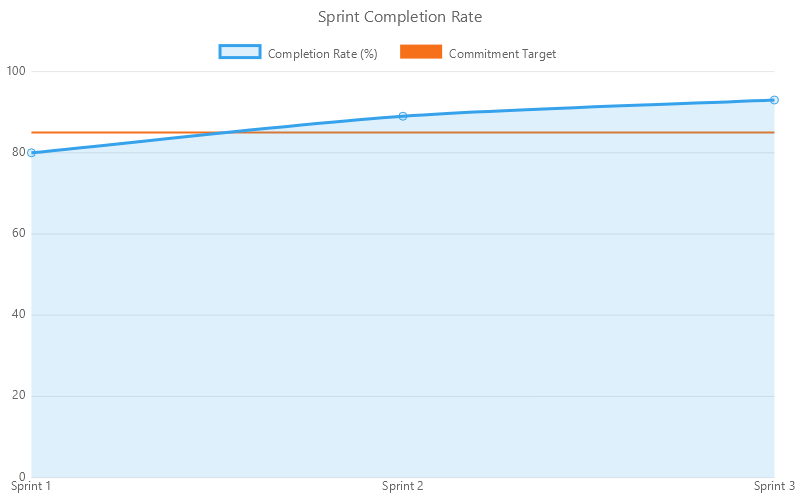
using ChartCS.Core;
using ChartCS.Fluent;
using ChartCS.SkiaSharp;

var config = ChartBuilder.Create(ChartType.Line)
    .Title("Weekly Active Users")
    .Legend(position: LegendPosition.Bottom)
    .Labels("Mon", "Tue", "Wed", "Thu", "Fri", "Sat", "Sun")
    .Dataset(d => d
        .Label("This week")
        .Data(420, 465, 490, 470, 540, 380, 350)
        .BorderColors("#36a2eb")
        .BackgroundColors("rgba(54, 162, 235, 0.2)")
        .Fill()
        .Tension(0.4)
        .PointRadius(4))
    .Dataset(d => d
        .Label("Last week")
        .Data(390, 410, 440, 460, 500, 420, 390)
        .BorderColors("#ff6384")
        .Tension(0.4)
        .PointRadius(4))
    .BeginAtZero()
    .Build();

ChartRenderer.RenderToPngFile(config, "fluent.png", 800, 500);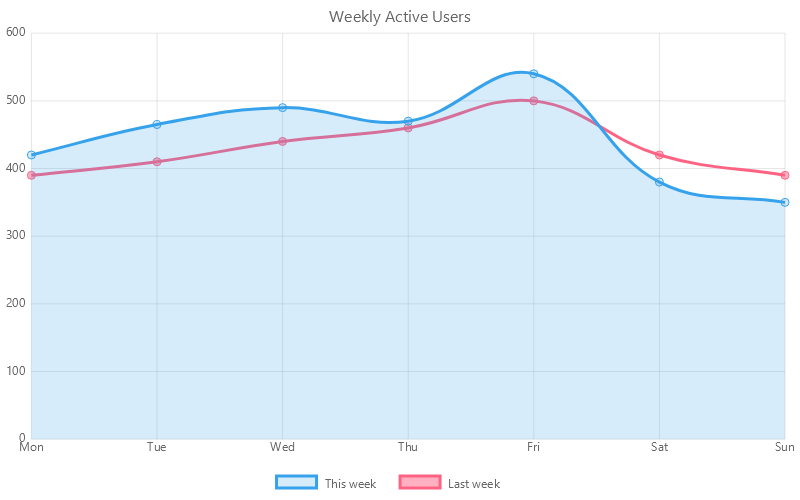
 |
 |
 |
 |
 |
 |
 |
 |
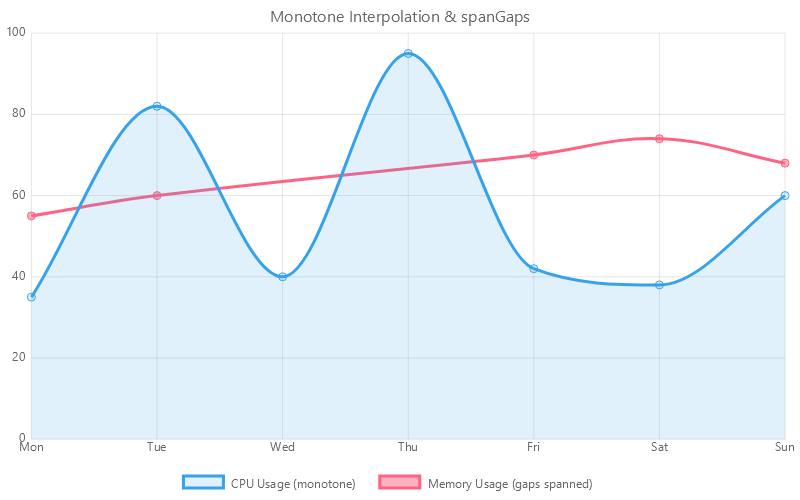 |
Every image above is produced by the demo project — run it yourself:
dotnet run --project samples/ChartCS.Demo # writes PNGs to samples/out/The demo also renders every *.json file in samples/ChartCS.Demo/samples/ (one Chart.js-format
config per chart type) — drop your own config there to try it.
| Package | Contents |
|---|---|
ChartCS.Core |
Configuration model (datasets, scales, plugins) + Chart.js JSON (de)serialization. No rendering dependencies. |
ChartCS.SkiaSharp |
The PNG renderer (ChartRenderer.RenderToPng/RenderToPngFile). |
ChartCS.Fluent |
ChartBuilder/DatasetBuilder chainable configuration API. |
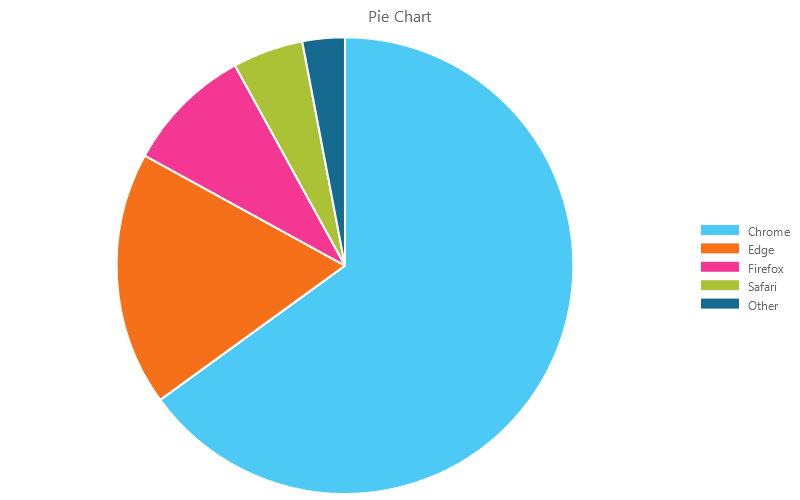
Implemented: category & linear scales with Chart.js nice-number ticks, min/max/suggestedMin/suggestedMax/beginAtZero, axis titles & grid & autoskip & reverse, grouped/stacked bars with barPercentage/categoryPercentage, line fills, tension, cubicInterpolationMode: "monotone", spanGaps, showLine, doughnut cutoutPercentage, per-slice arc colors with white borders, legends (per dataset / per slice, position, align, reverse, usePointStyle), titles & subtitles, bubble pixel radii.
Not implemented yet: horizontal bars (indexAxis: "y"), multiple/custom axes, logarithmic & time scales, mixed chart types, dashed borders, point shapes other than circle, tooltips & animation (meaningless for static images). Details in docs/ARCHITECTURE.md.