


- Identified 41.5x-lift product bundles through SQL/R analysis of 540K+ transactions, enabling targeted retention strategies.
- Interactive Tableau dashboard (linked here) unifies key metrics, filters by RFM segments, bundles, and country.
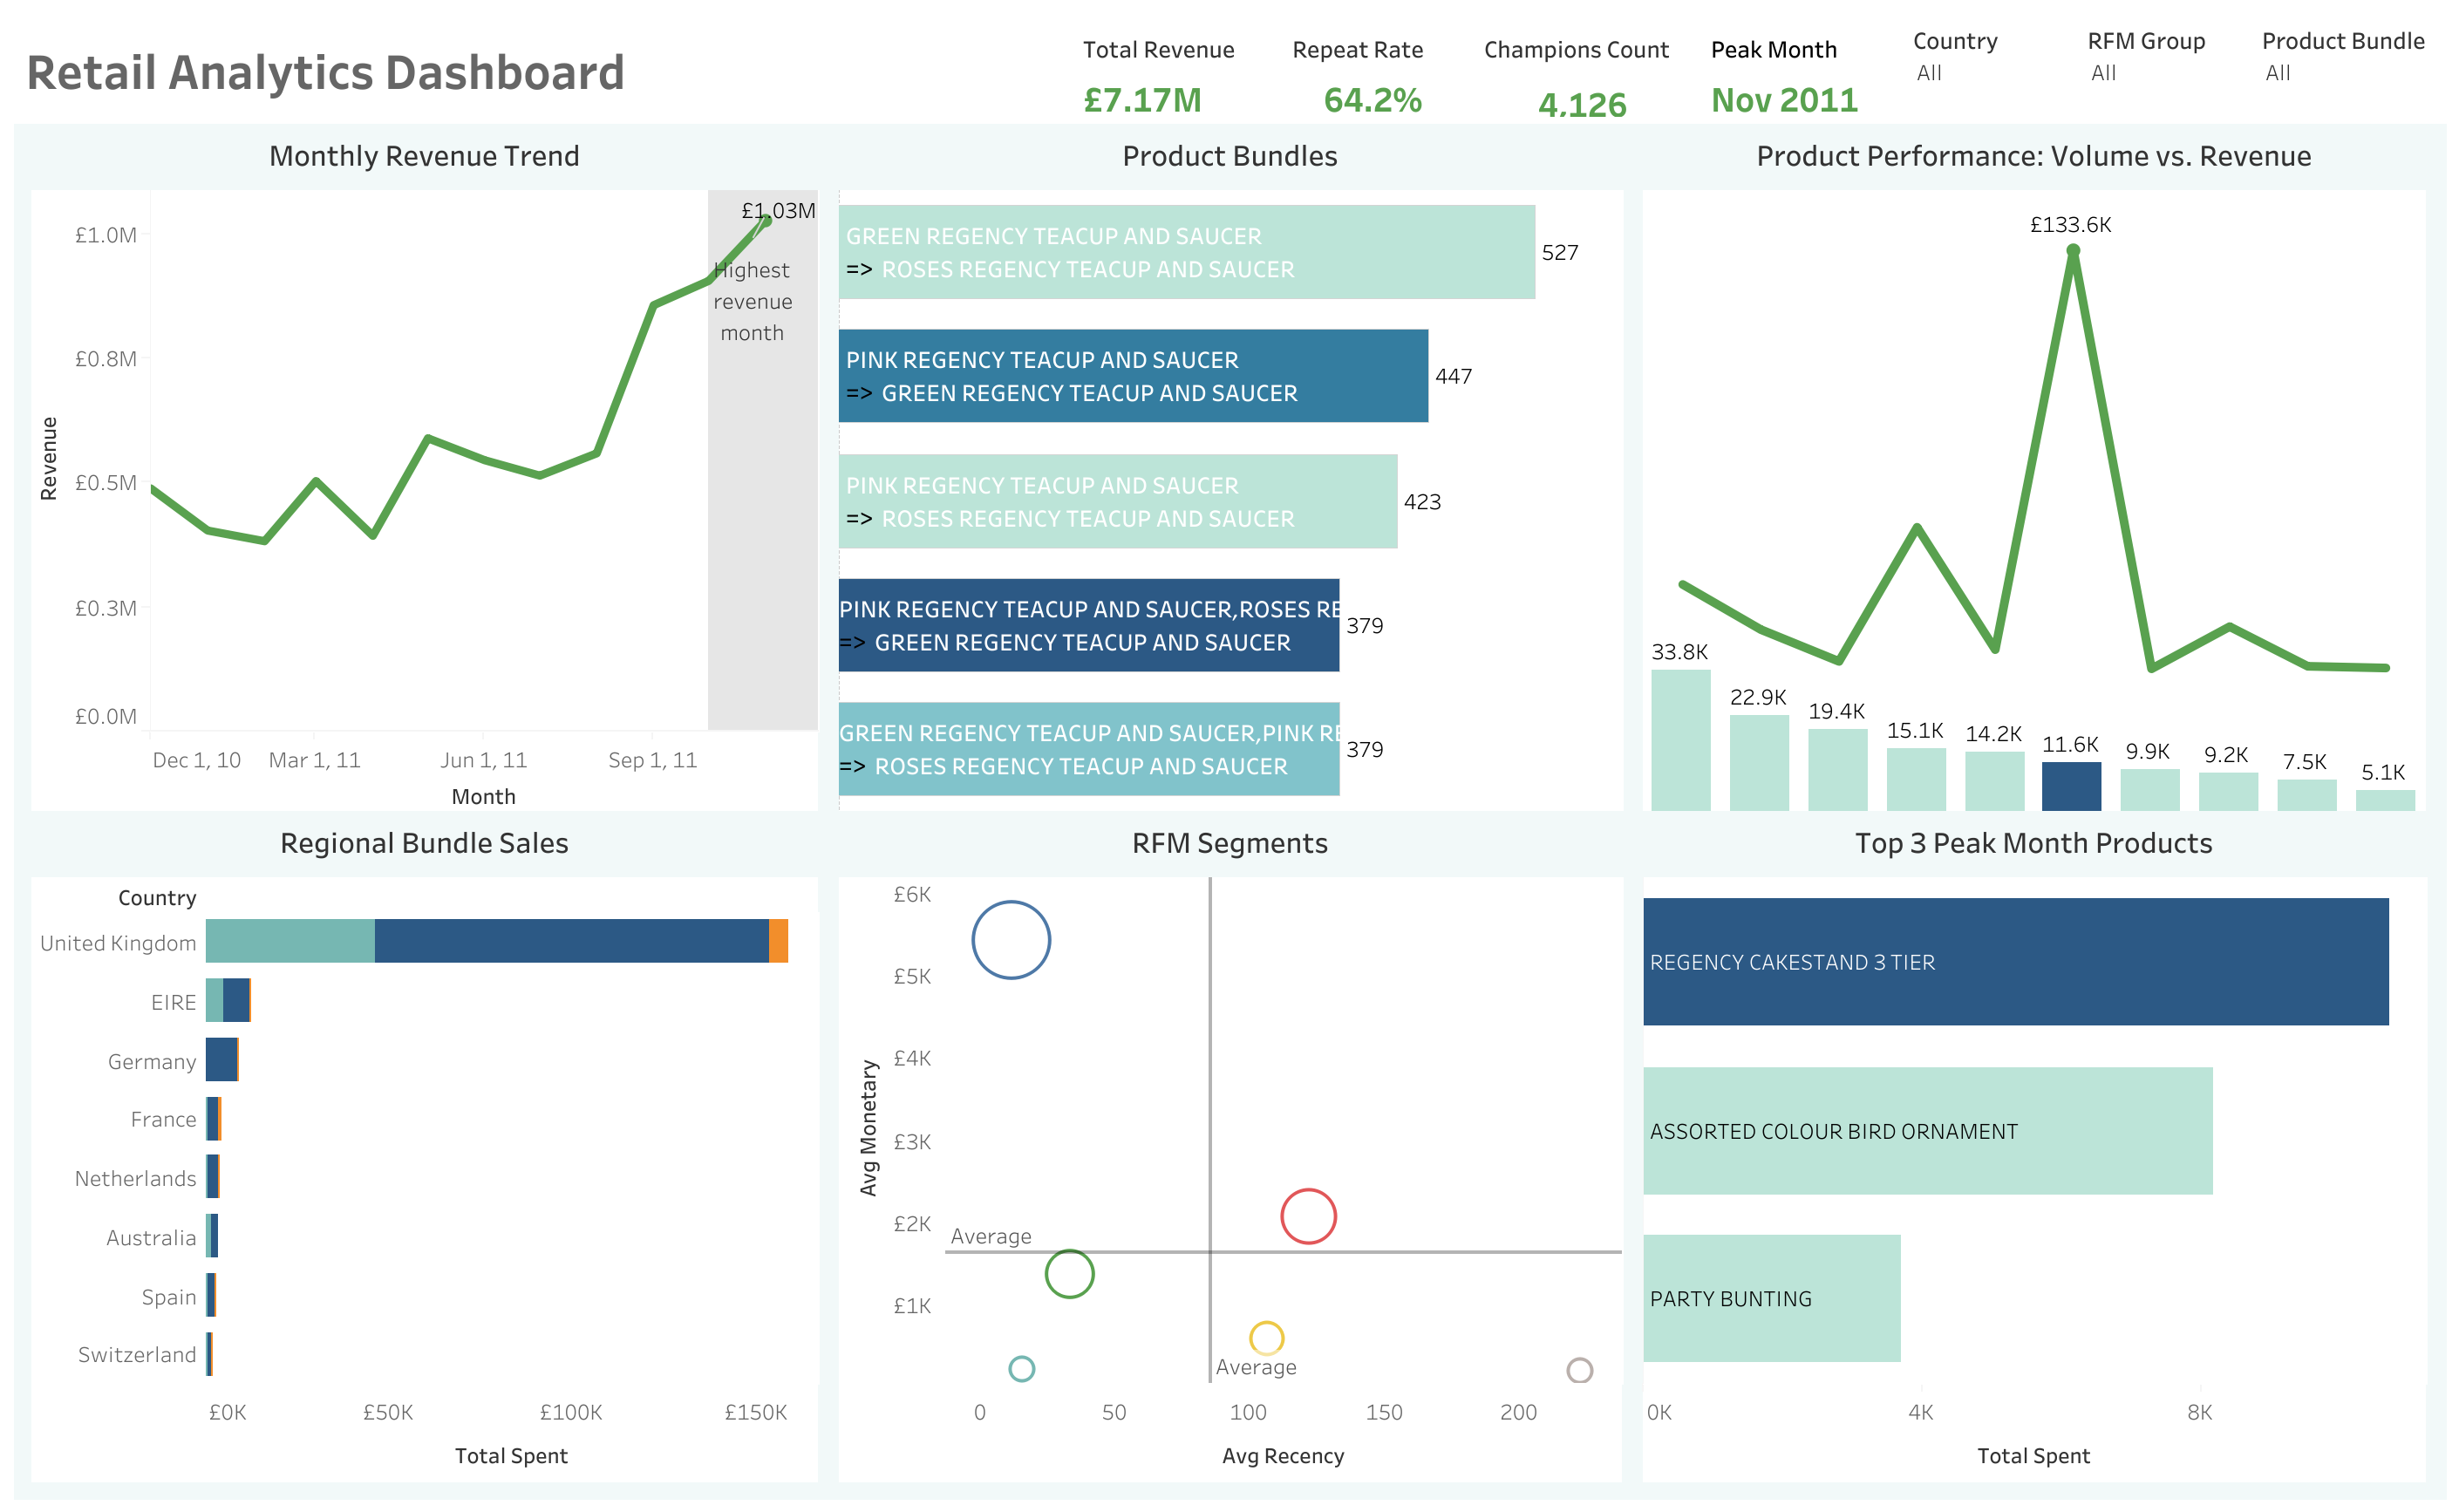
- SQL : Complex RFM segmentation using window functions
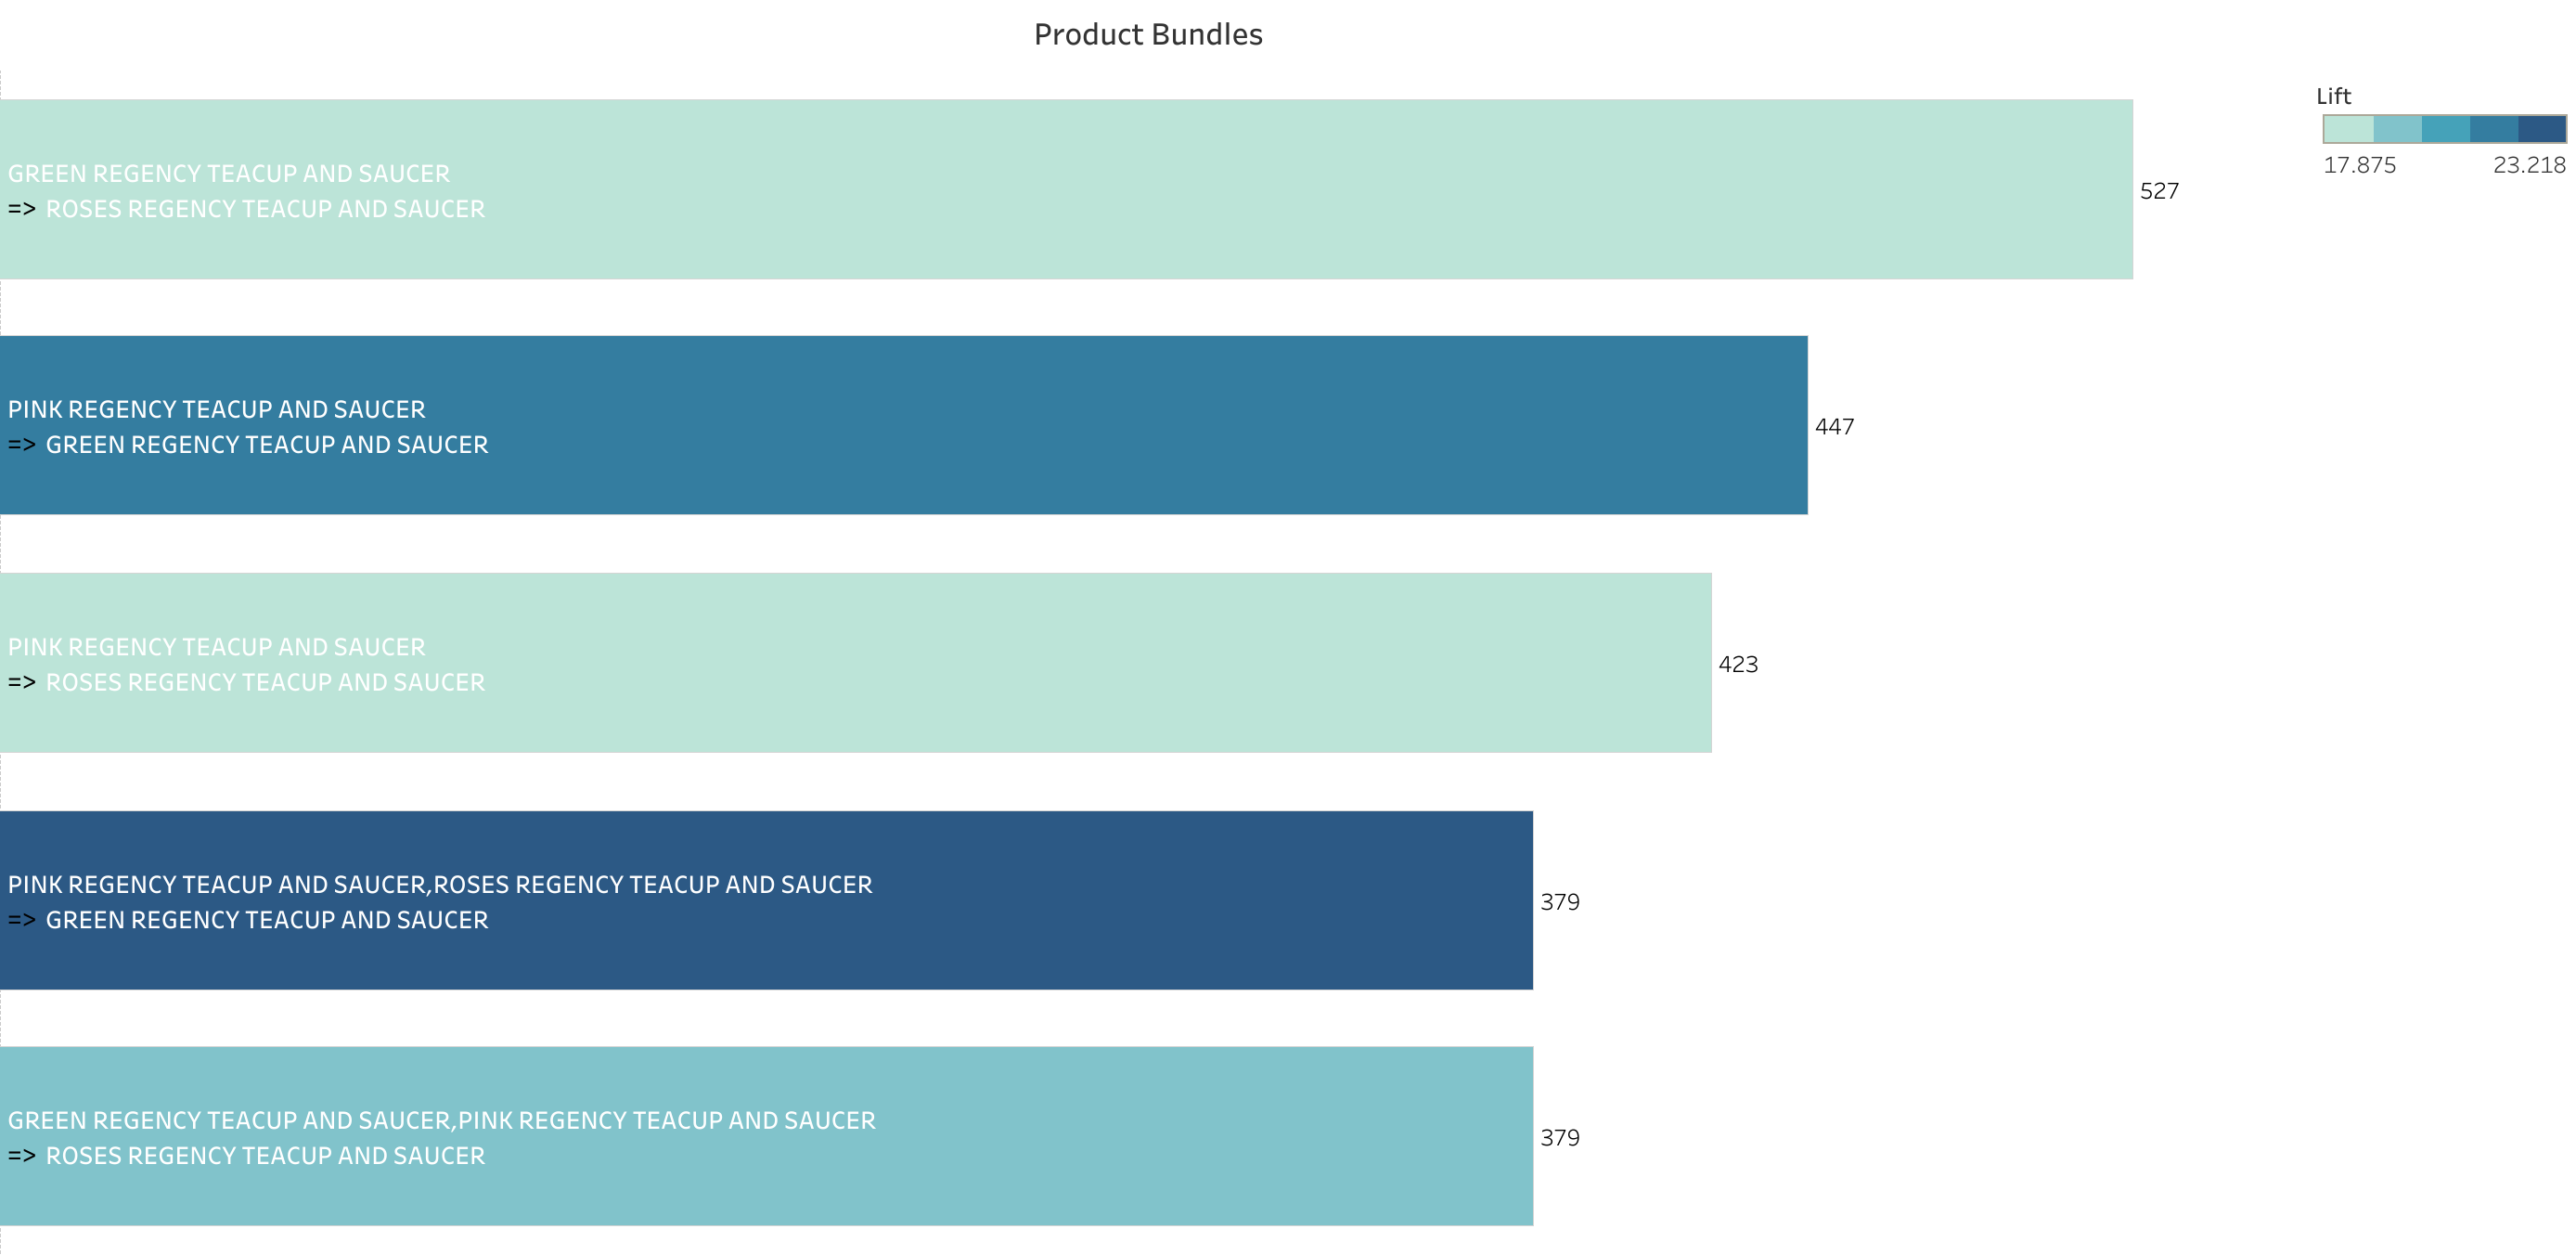
- R : Market basket analysis (arules package) with 41.5x bundle lift
- Tableau : Dynamic dashboard with parameter-driven filters (30% faster decisions).
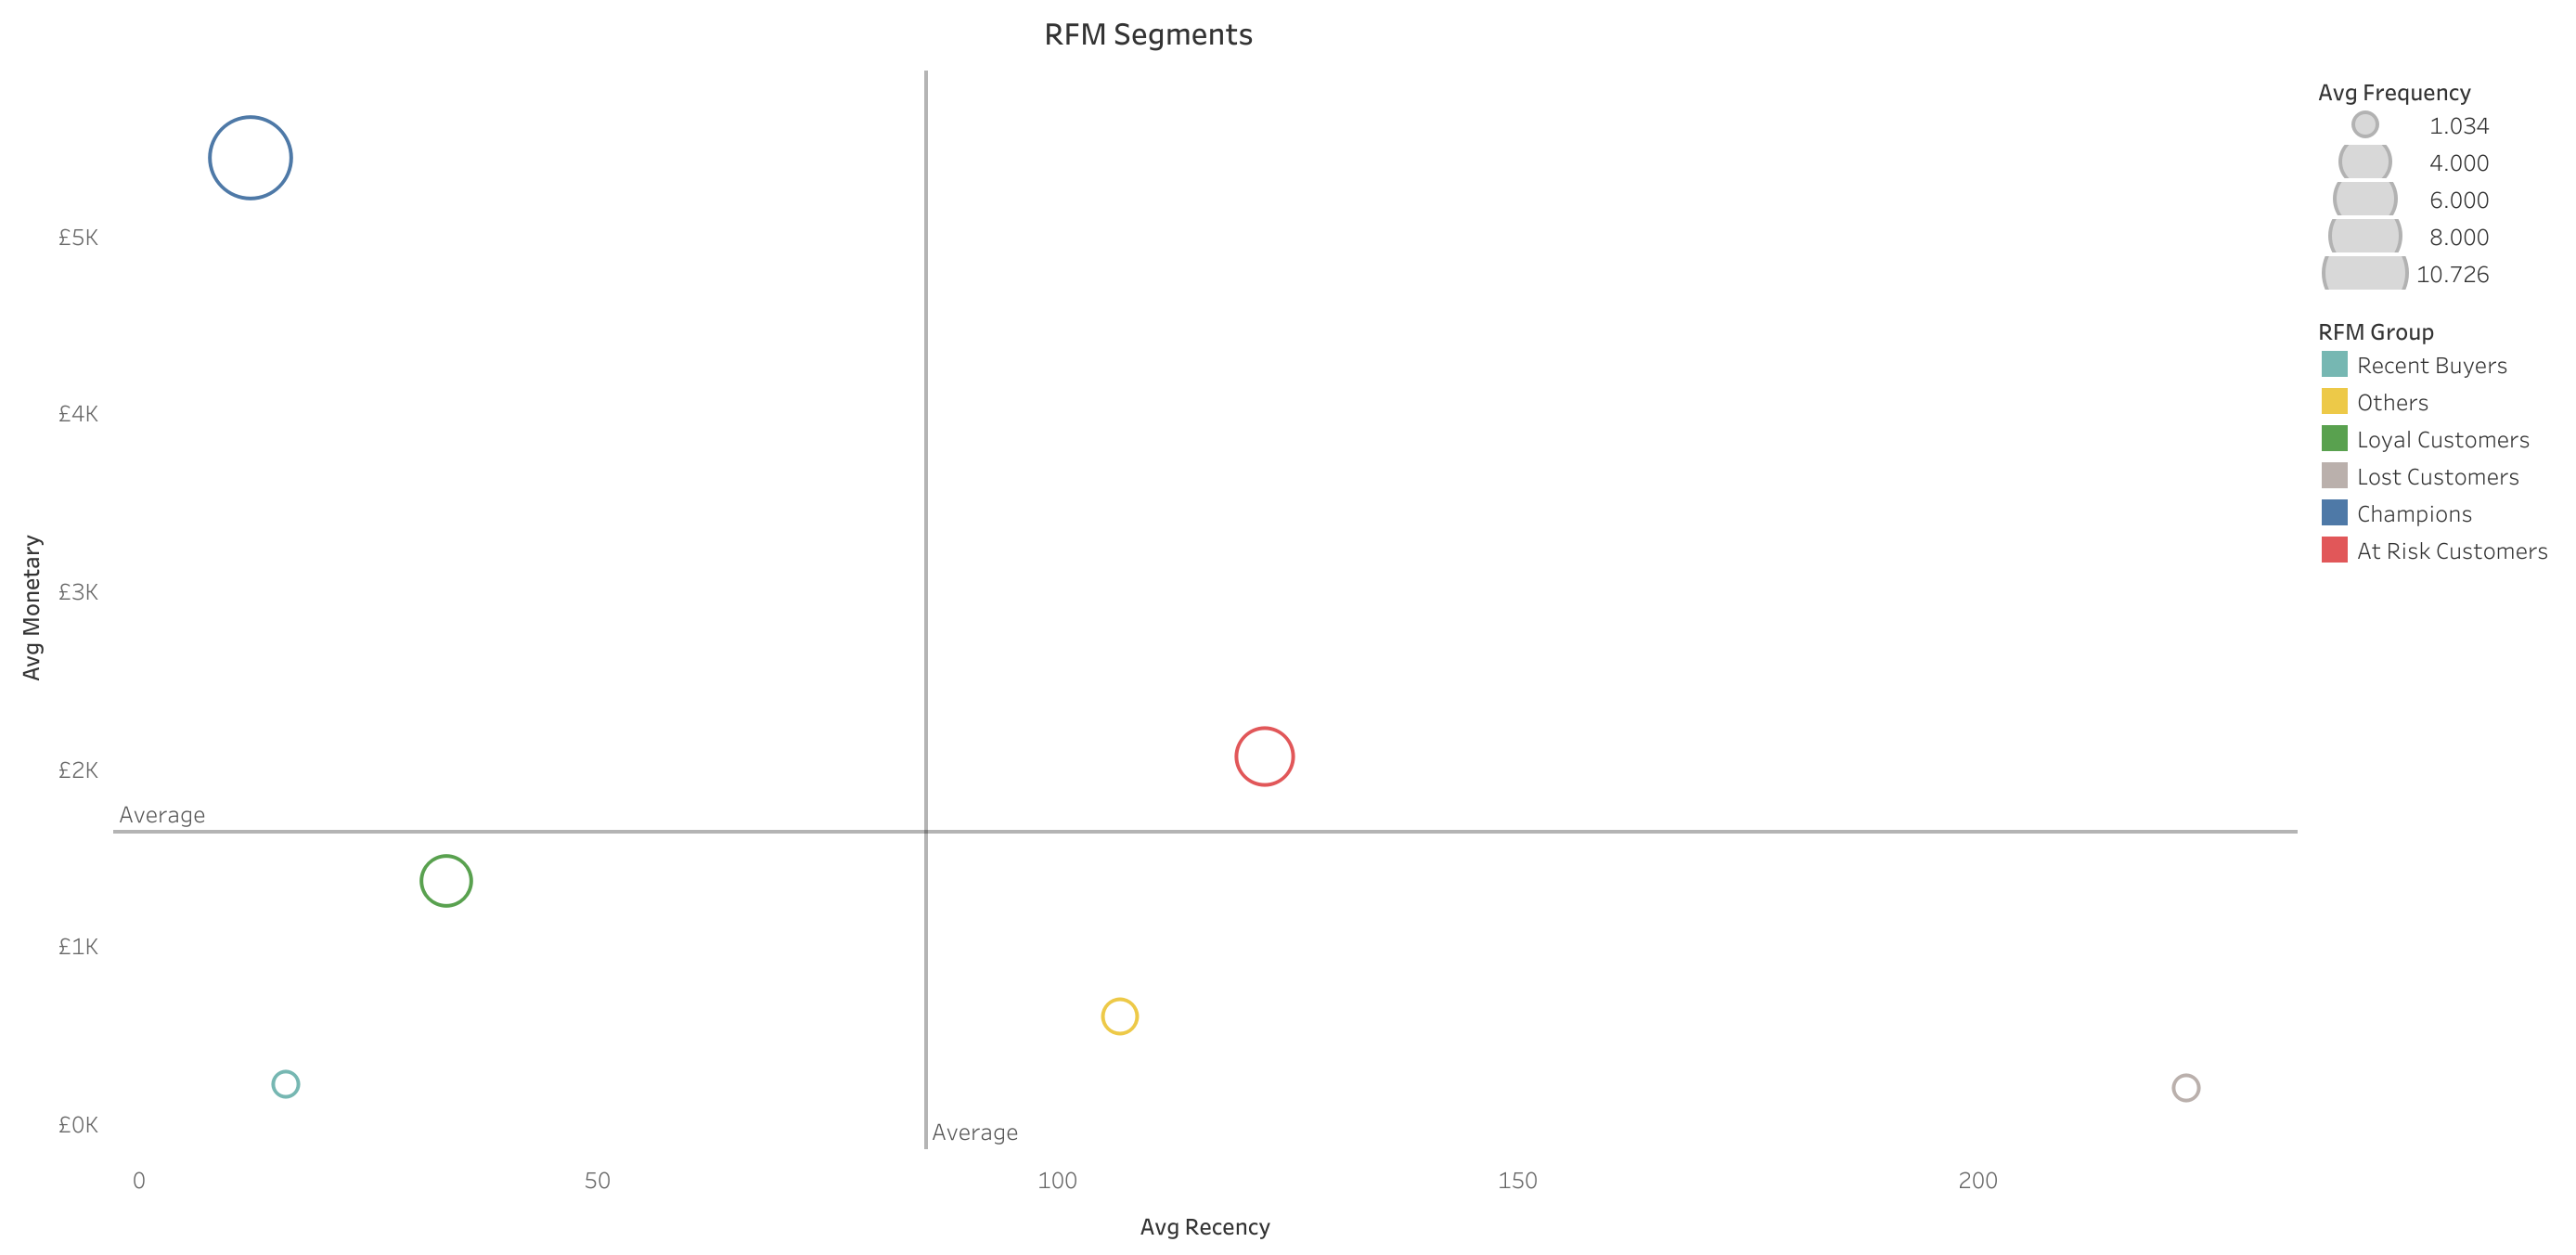
- Proposed bundling strategy for £5.4K avg-spend "Champion" cohort
- Estimated a £350K revenue opportunity from public-dataset segmentation and product-bundling analysis
- Illustrative strategic actions: 10% discount bundles and VIP early access
This public-data demonstration applies RFM segmentation and market-basket analysis to the UCI Online Retail dataset, which contains more than 500,000 transaction records. The objective is to show how a retail analytics workflow can identify customer segments, product-bundling opportunities, and revenue-growth hypotheses.
- SQL (MySQL Workbench) : for data cleaning and preparation
- R (RStudio) : for EDA, Market Basket Analysis, and RFM segmentation
- Tableau Desktop : for building business dashboards
- GitHub : for documentation and version control
- Cleaned over 540K raw records from a retail dataset
- Removed cancelled orders, rows with missing critical fields, outliers, and duplicates
- Created additional fields:
InvoiceYearMonth,TotalSpent,RFM Group, andProductBundle
- Cleaned data in SQL and exported as .csv file
- Prepared output files for Tableau
- Designed and exported final visualizations and dashboard to Tableau public
- Translated segment and product-affinity results into illustrative retention and bundling recommendations
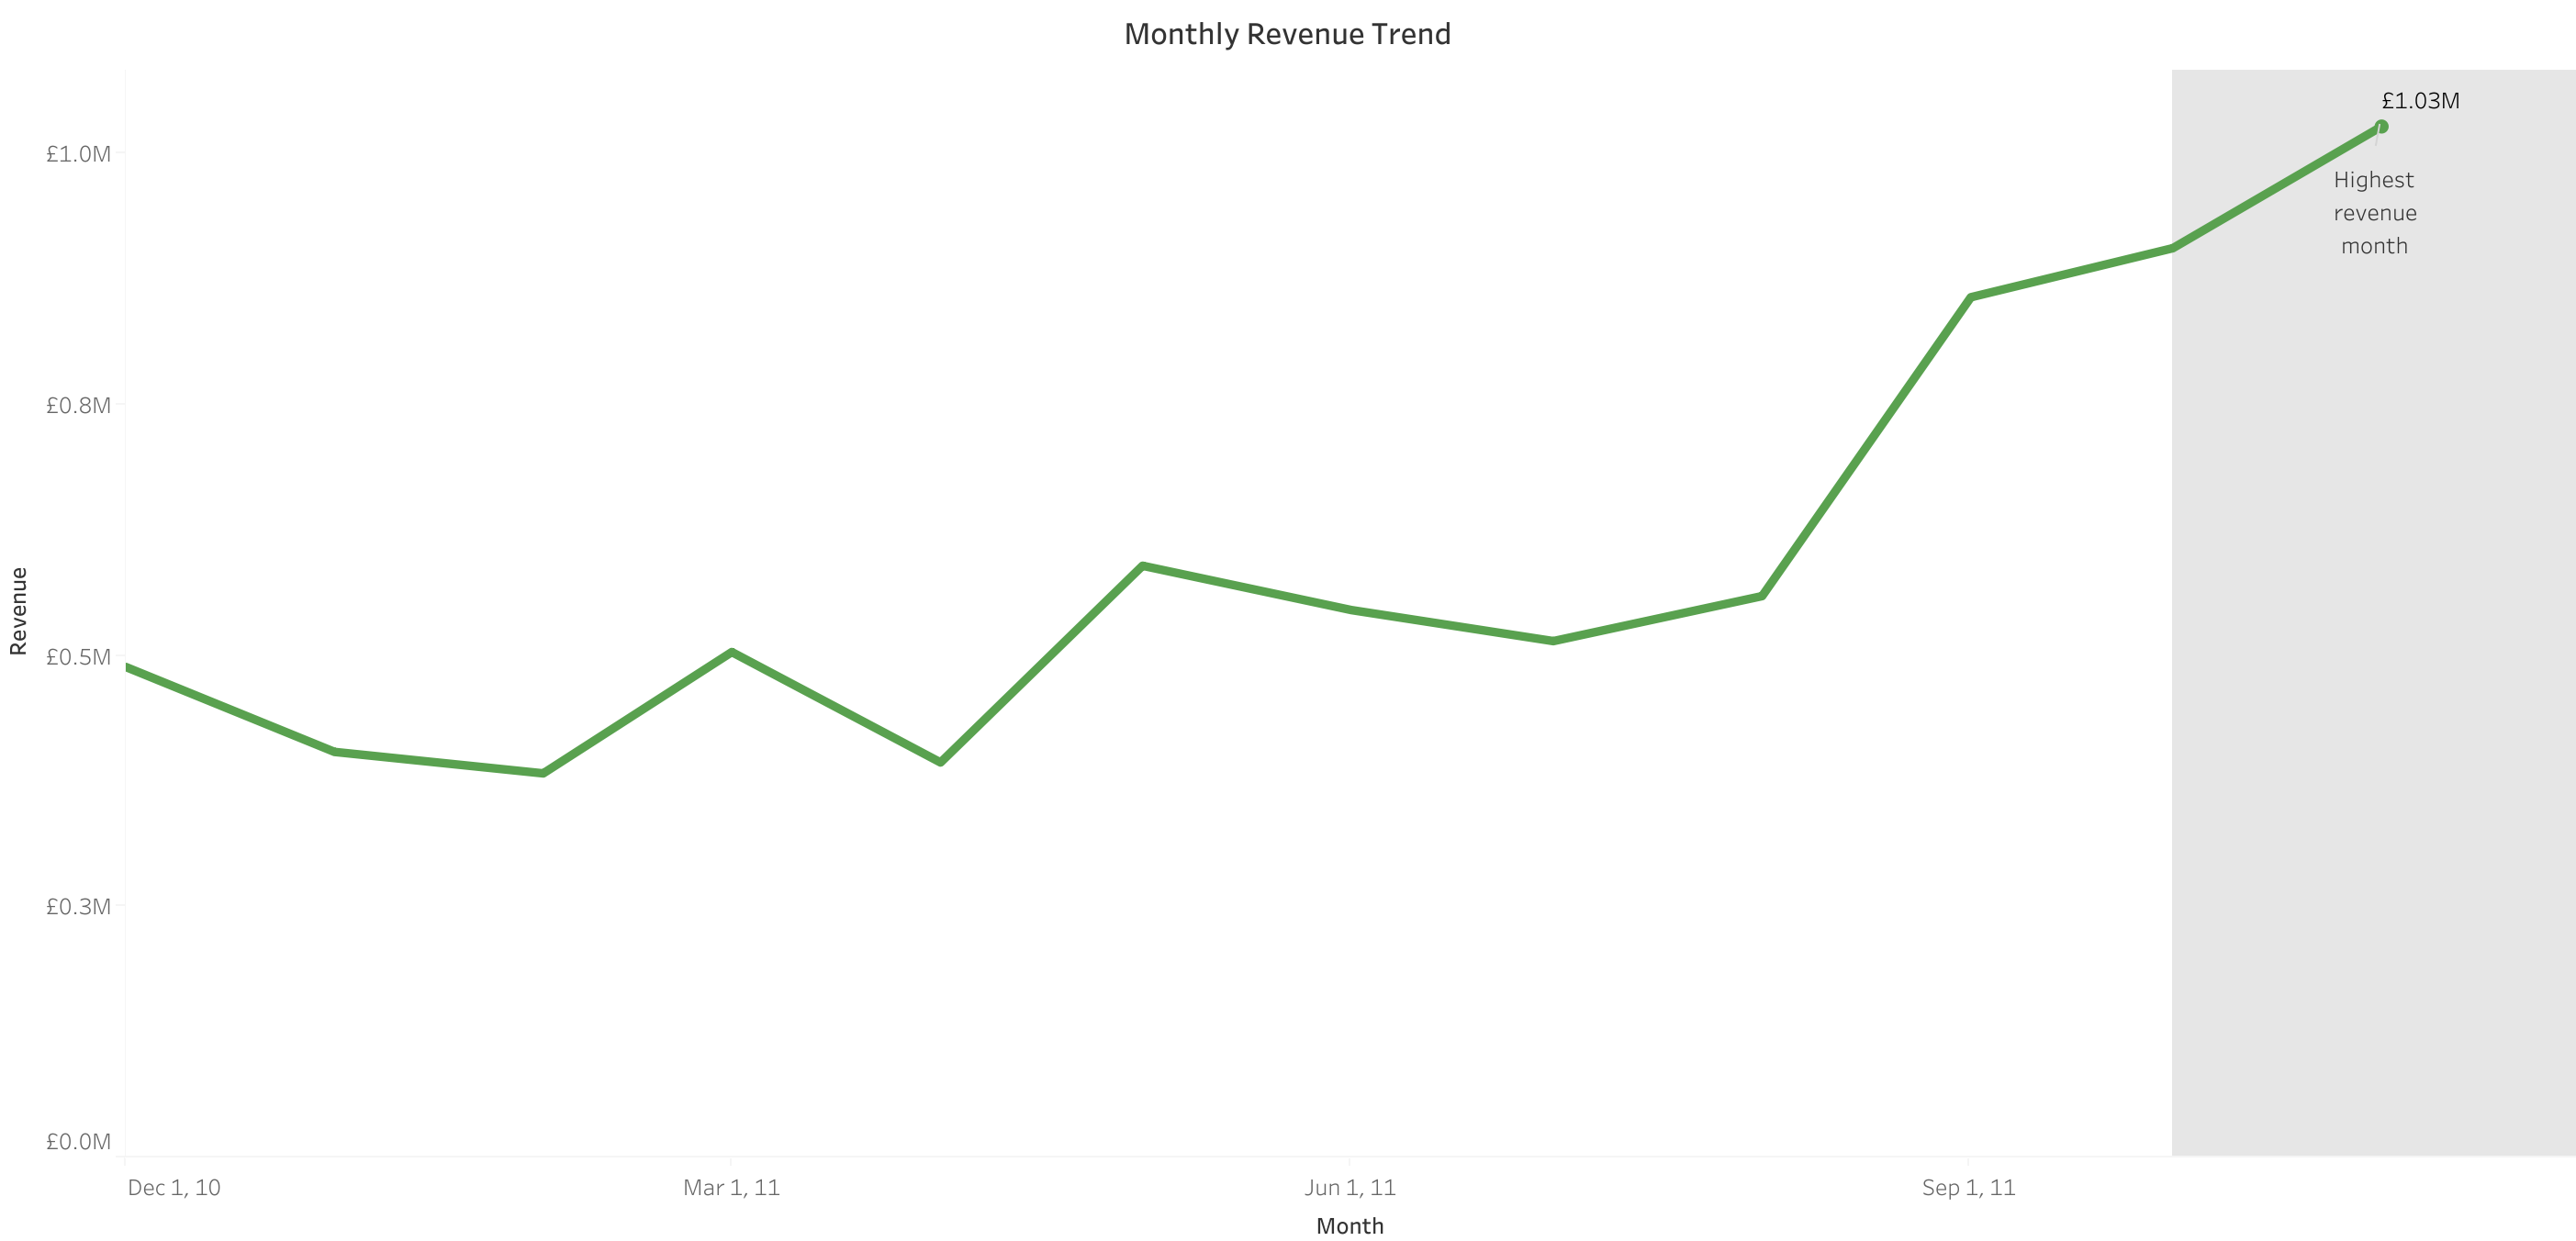
- November 2011 recorded £1.05M, a 75% increase vs. monthly average, ideal for seasonal promotions.
- Horizontal bar chart highlighting bundles like Poppy’s Playhouse and Regency Teacup Sets that outperform standalone products.
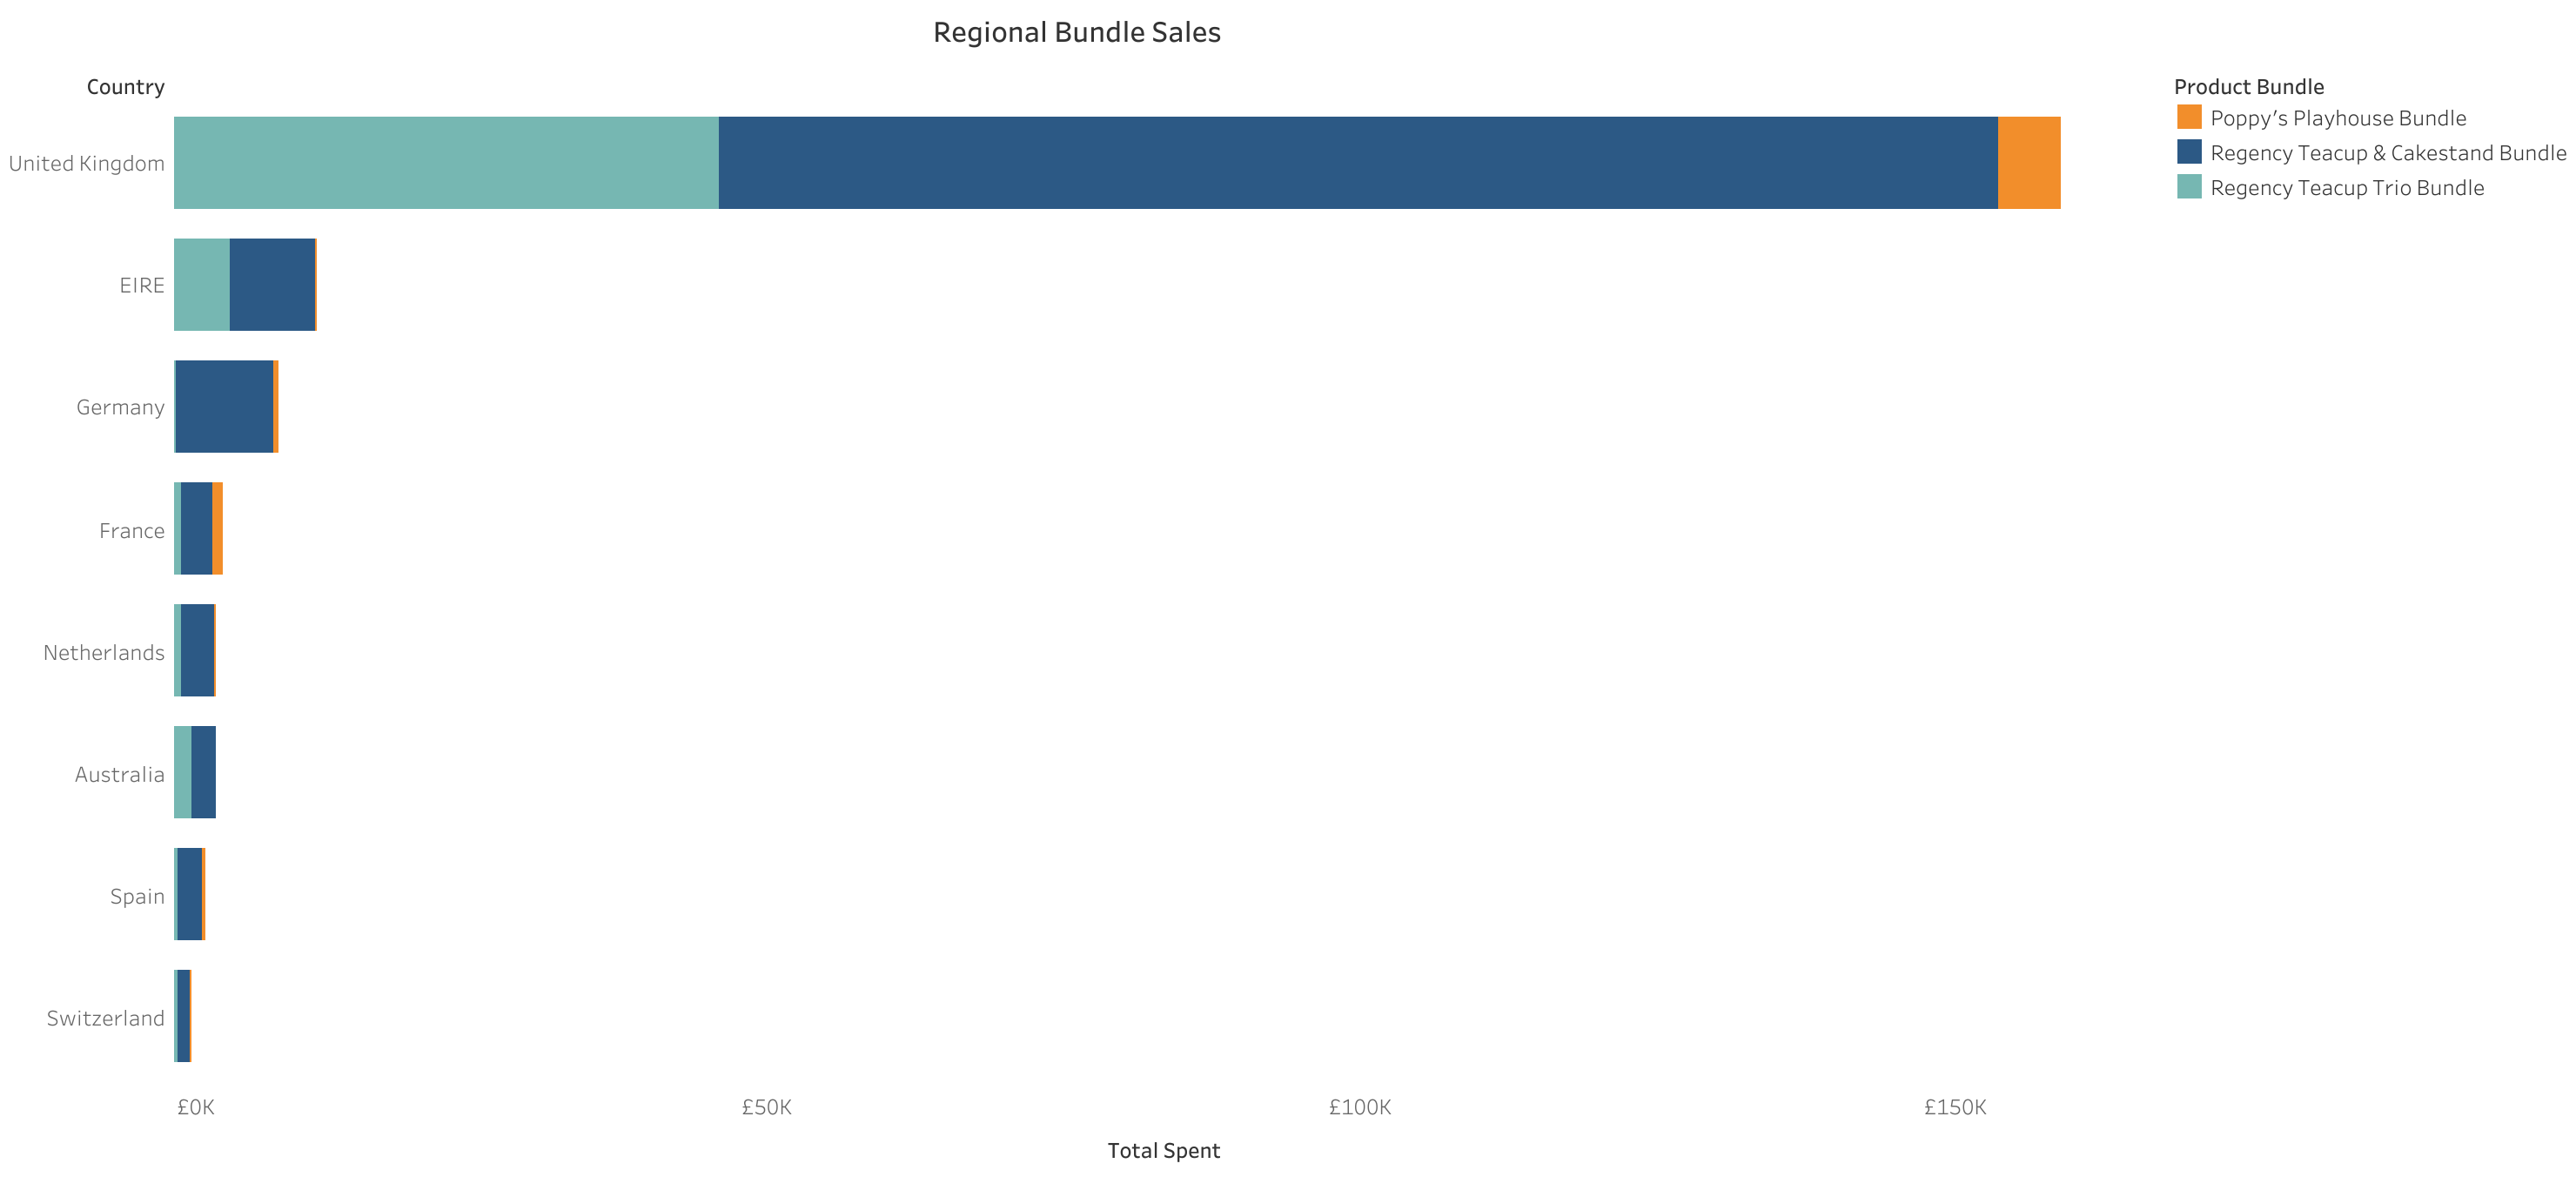
- Shows bundle performance by country, UK dominates volume and revenue, while Germany and Netherlands show niche interest.
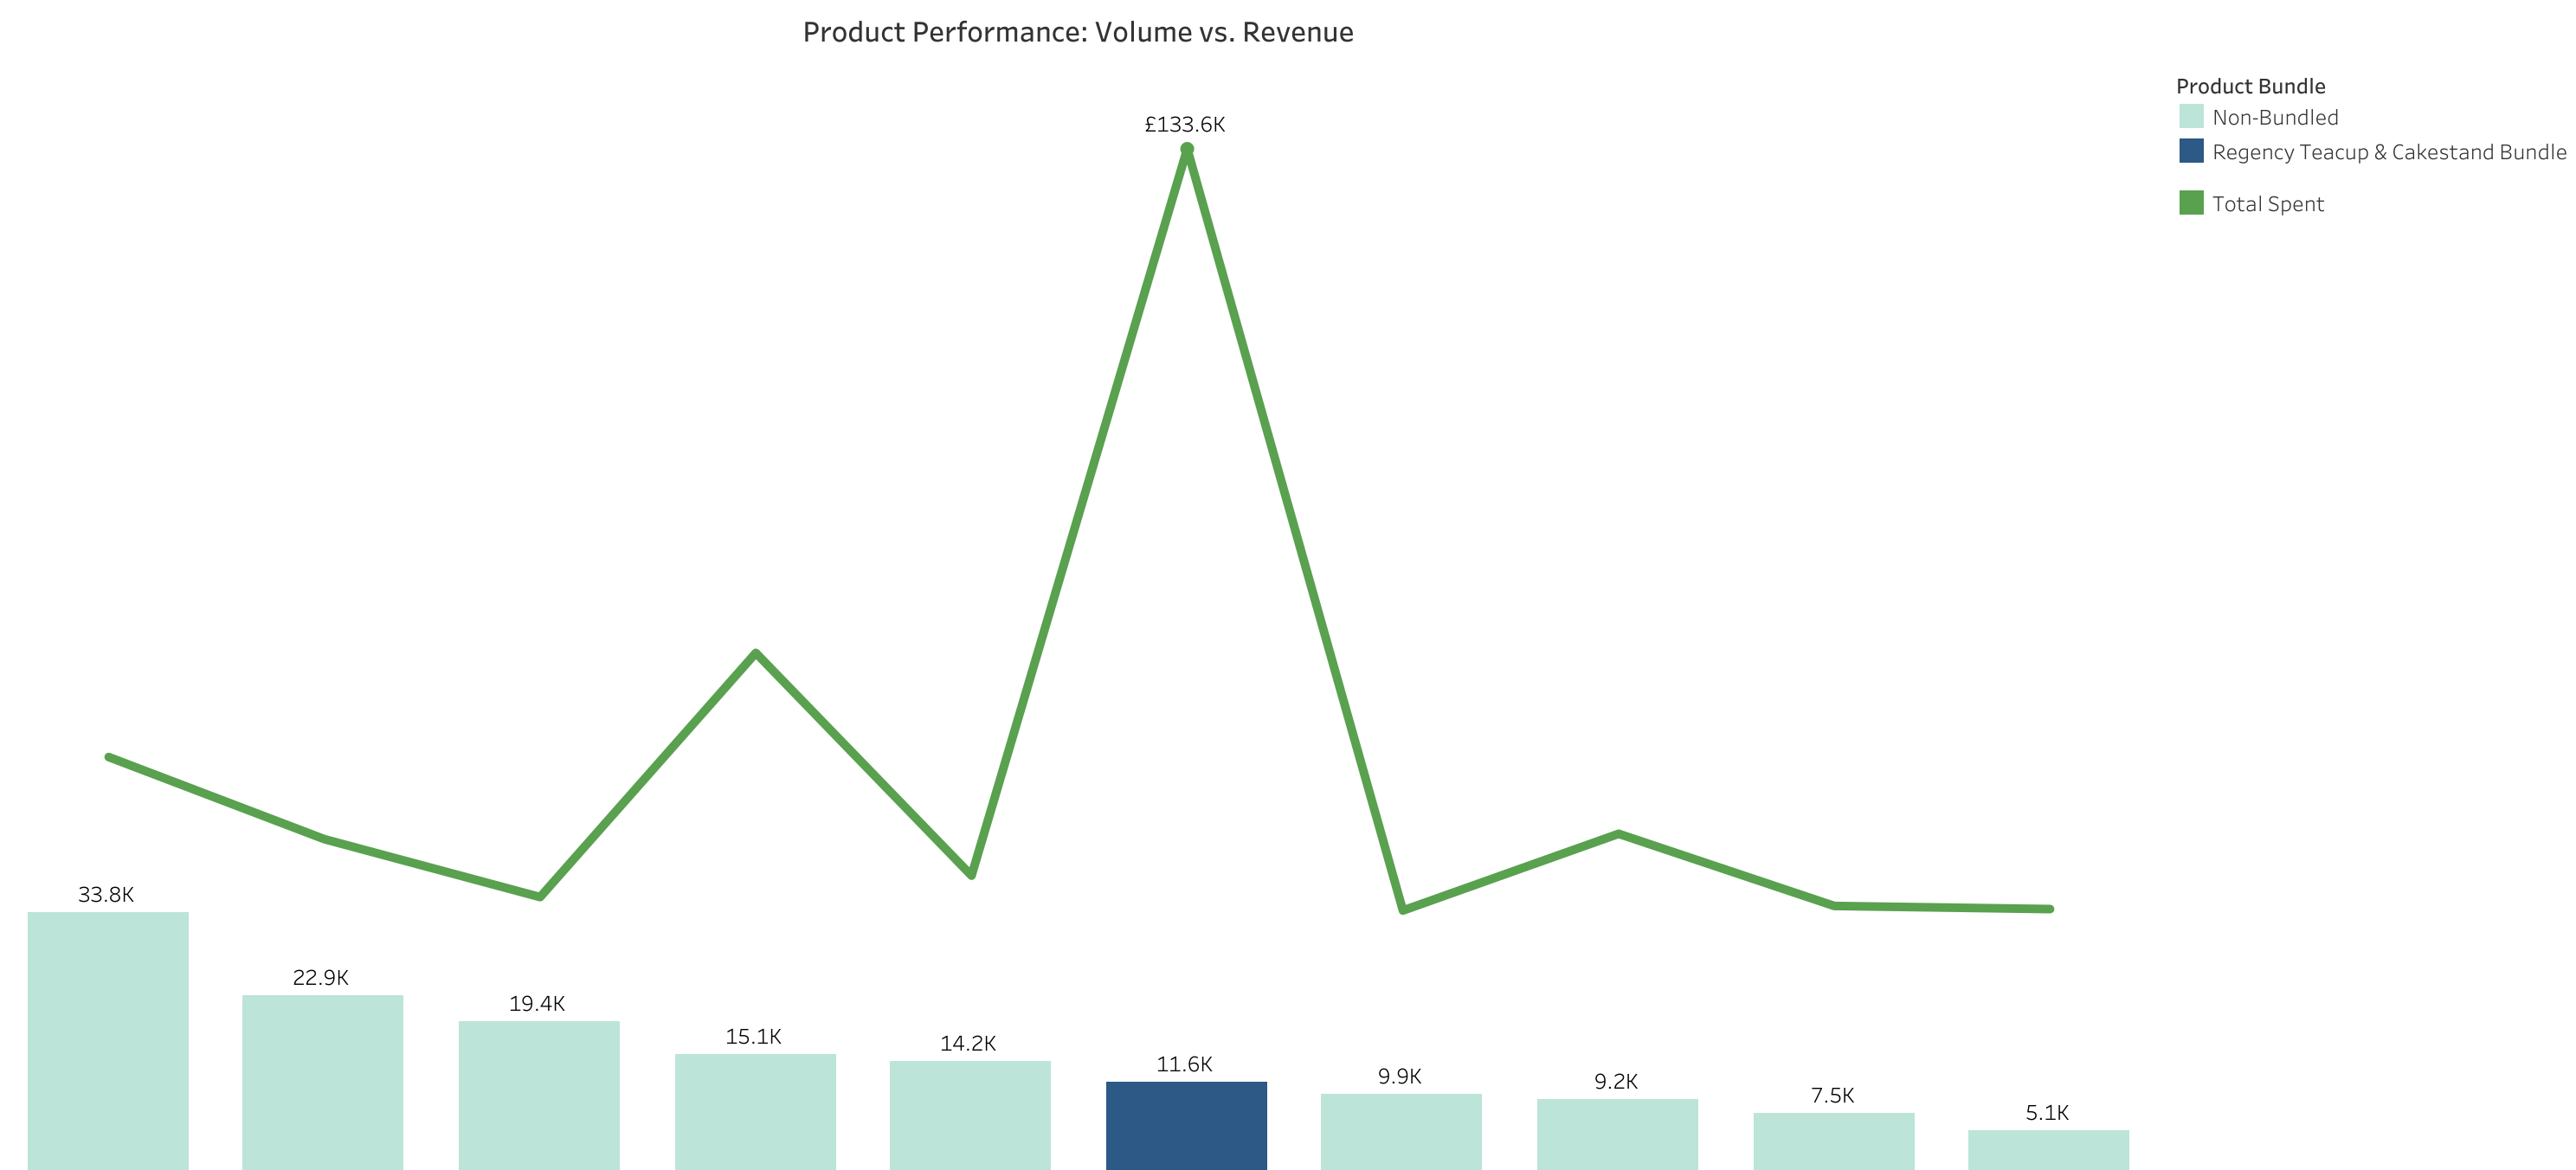
- Items like World War 2 Gliders lead in volume but not revenue. Regency Cakestand leads revenue despite moderate volume, supports value-based bundling.
- Segments customers into 6 groups (e.g., Champions, At Risk) using Recency, Frequency, and Monetary scores.
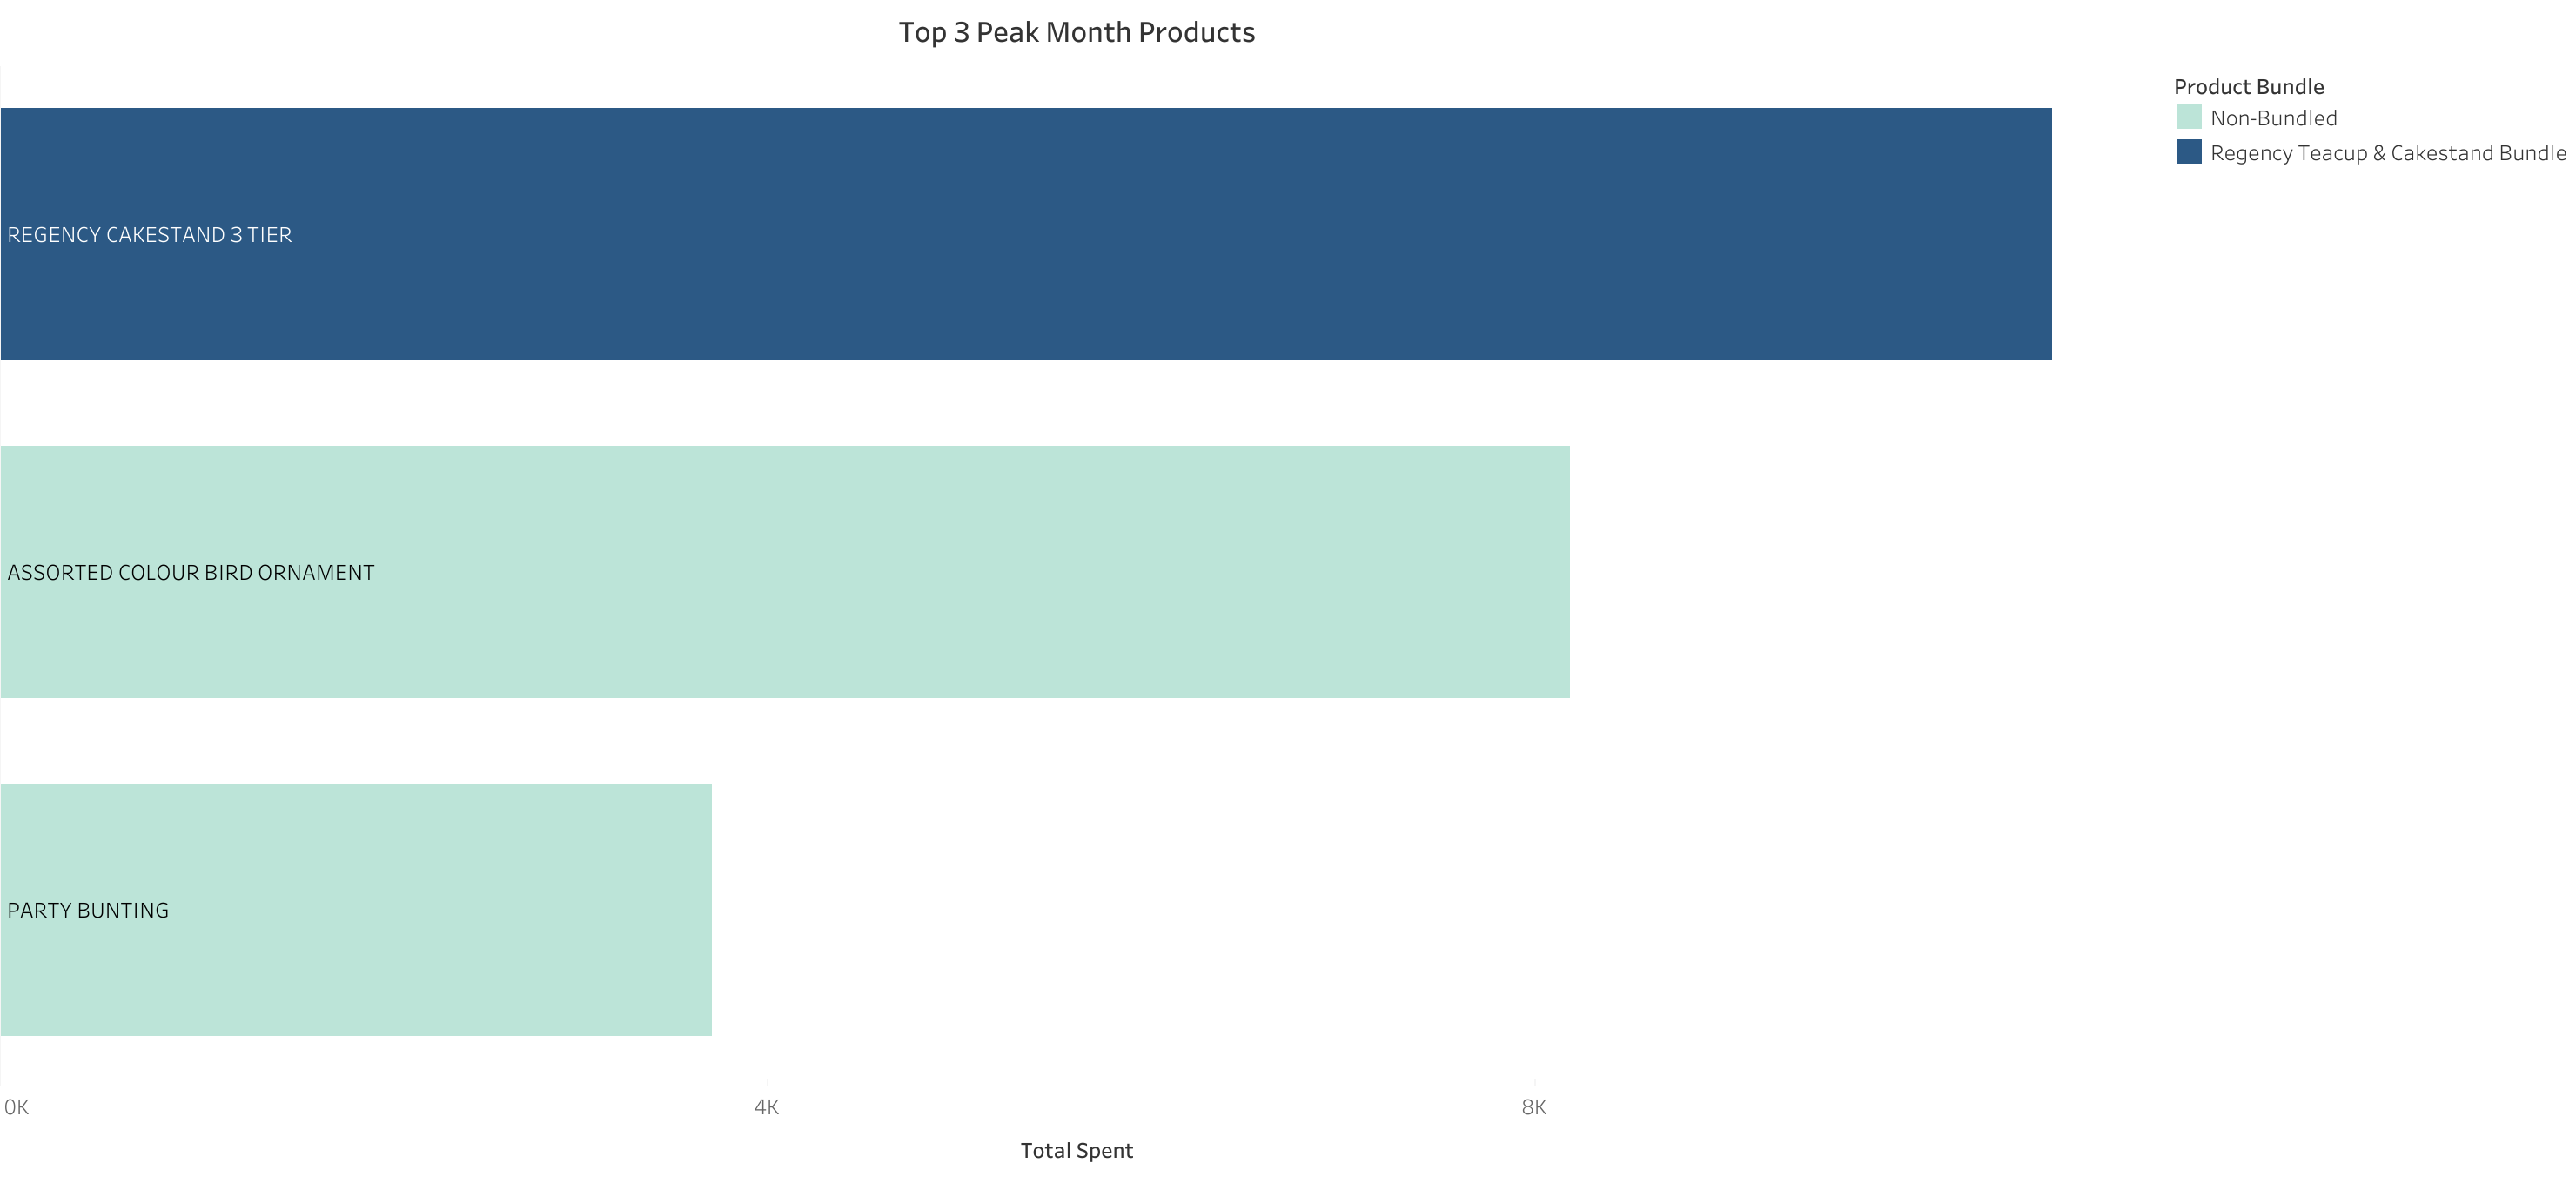
- Horizontal bar chart showing best-sellers for November: Rabbit Night Light, Paper Chain Kit, and Regency Cakestand.
- 63.8% of customers made repeat purchases
- Top revenue month: November 2011 (£1.05M)
- Top product by volume: World War 2 Gliders (52,956 units)
- Top product by revenue: Regency Cakestand (£137,707)
This project demonstrates how combining product affinity analysis with customer segmentation enables targeted pricing strategies, bundling, and retention efforts. Visual insights and business logic illustrate how these methods could support revenue growth in a comparable retail business. The methodologies used here—specifically RFM segmentation for customer cohort identification and market basket analysis for product affinity—provide a scalable framework for driving data-driven growth in mid-market retail environments.
- Run
01_import_data.sqlto set up the database, create base table, and bulk-load the raw .csv file - Run
02_clean_data.sqlto Clean and standardize the imported data. - Run
03_finalize_and_export.sqlto export the cleaned dataset.
- Run
EDA & Advanced Analysis.Rmdto perform EDA, Market Basket Analysis, and RFM segmentation.
- Open Open
Retail Analytics Dashboard.twbxand connect toonline_retail_viz_ready.csv,rfm_summary.csvand filtered_rules.csv.
- UCI Machine Learning Repository – 'Online Retail' Dataset (linked here)
- Association Rules via
arulesR package - RFM segmentation framework adapted from industry best practices