

System extension for Dashfy - Monitor CPU, memory, disk, network, and processes.
This extension provides widgets to display real-time resource metrics from the machine running the Dashfy server, collected with systeminformation.
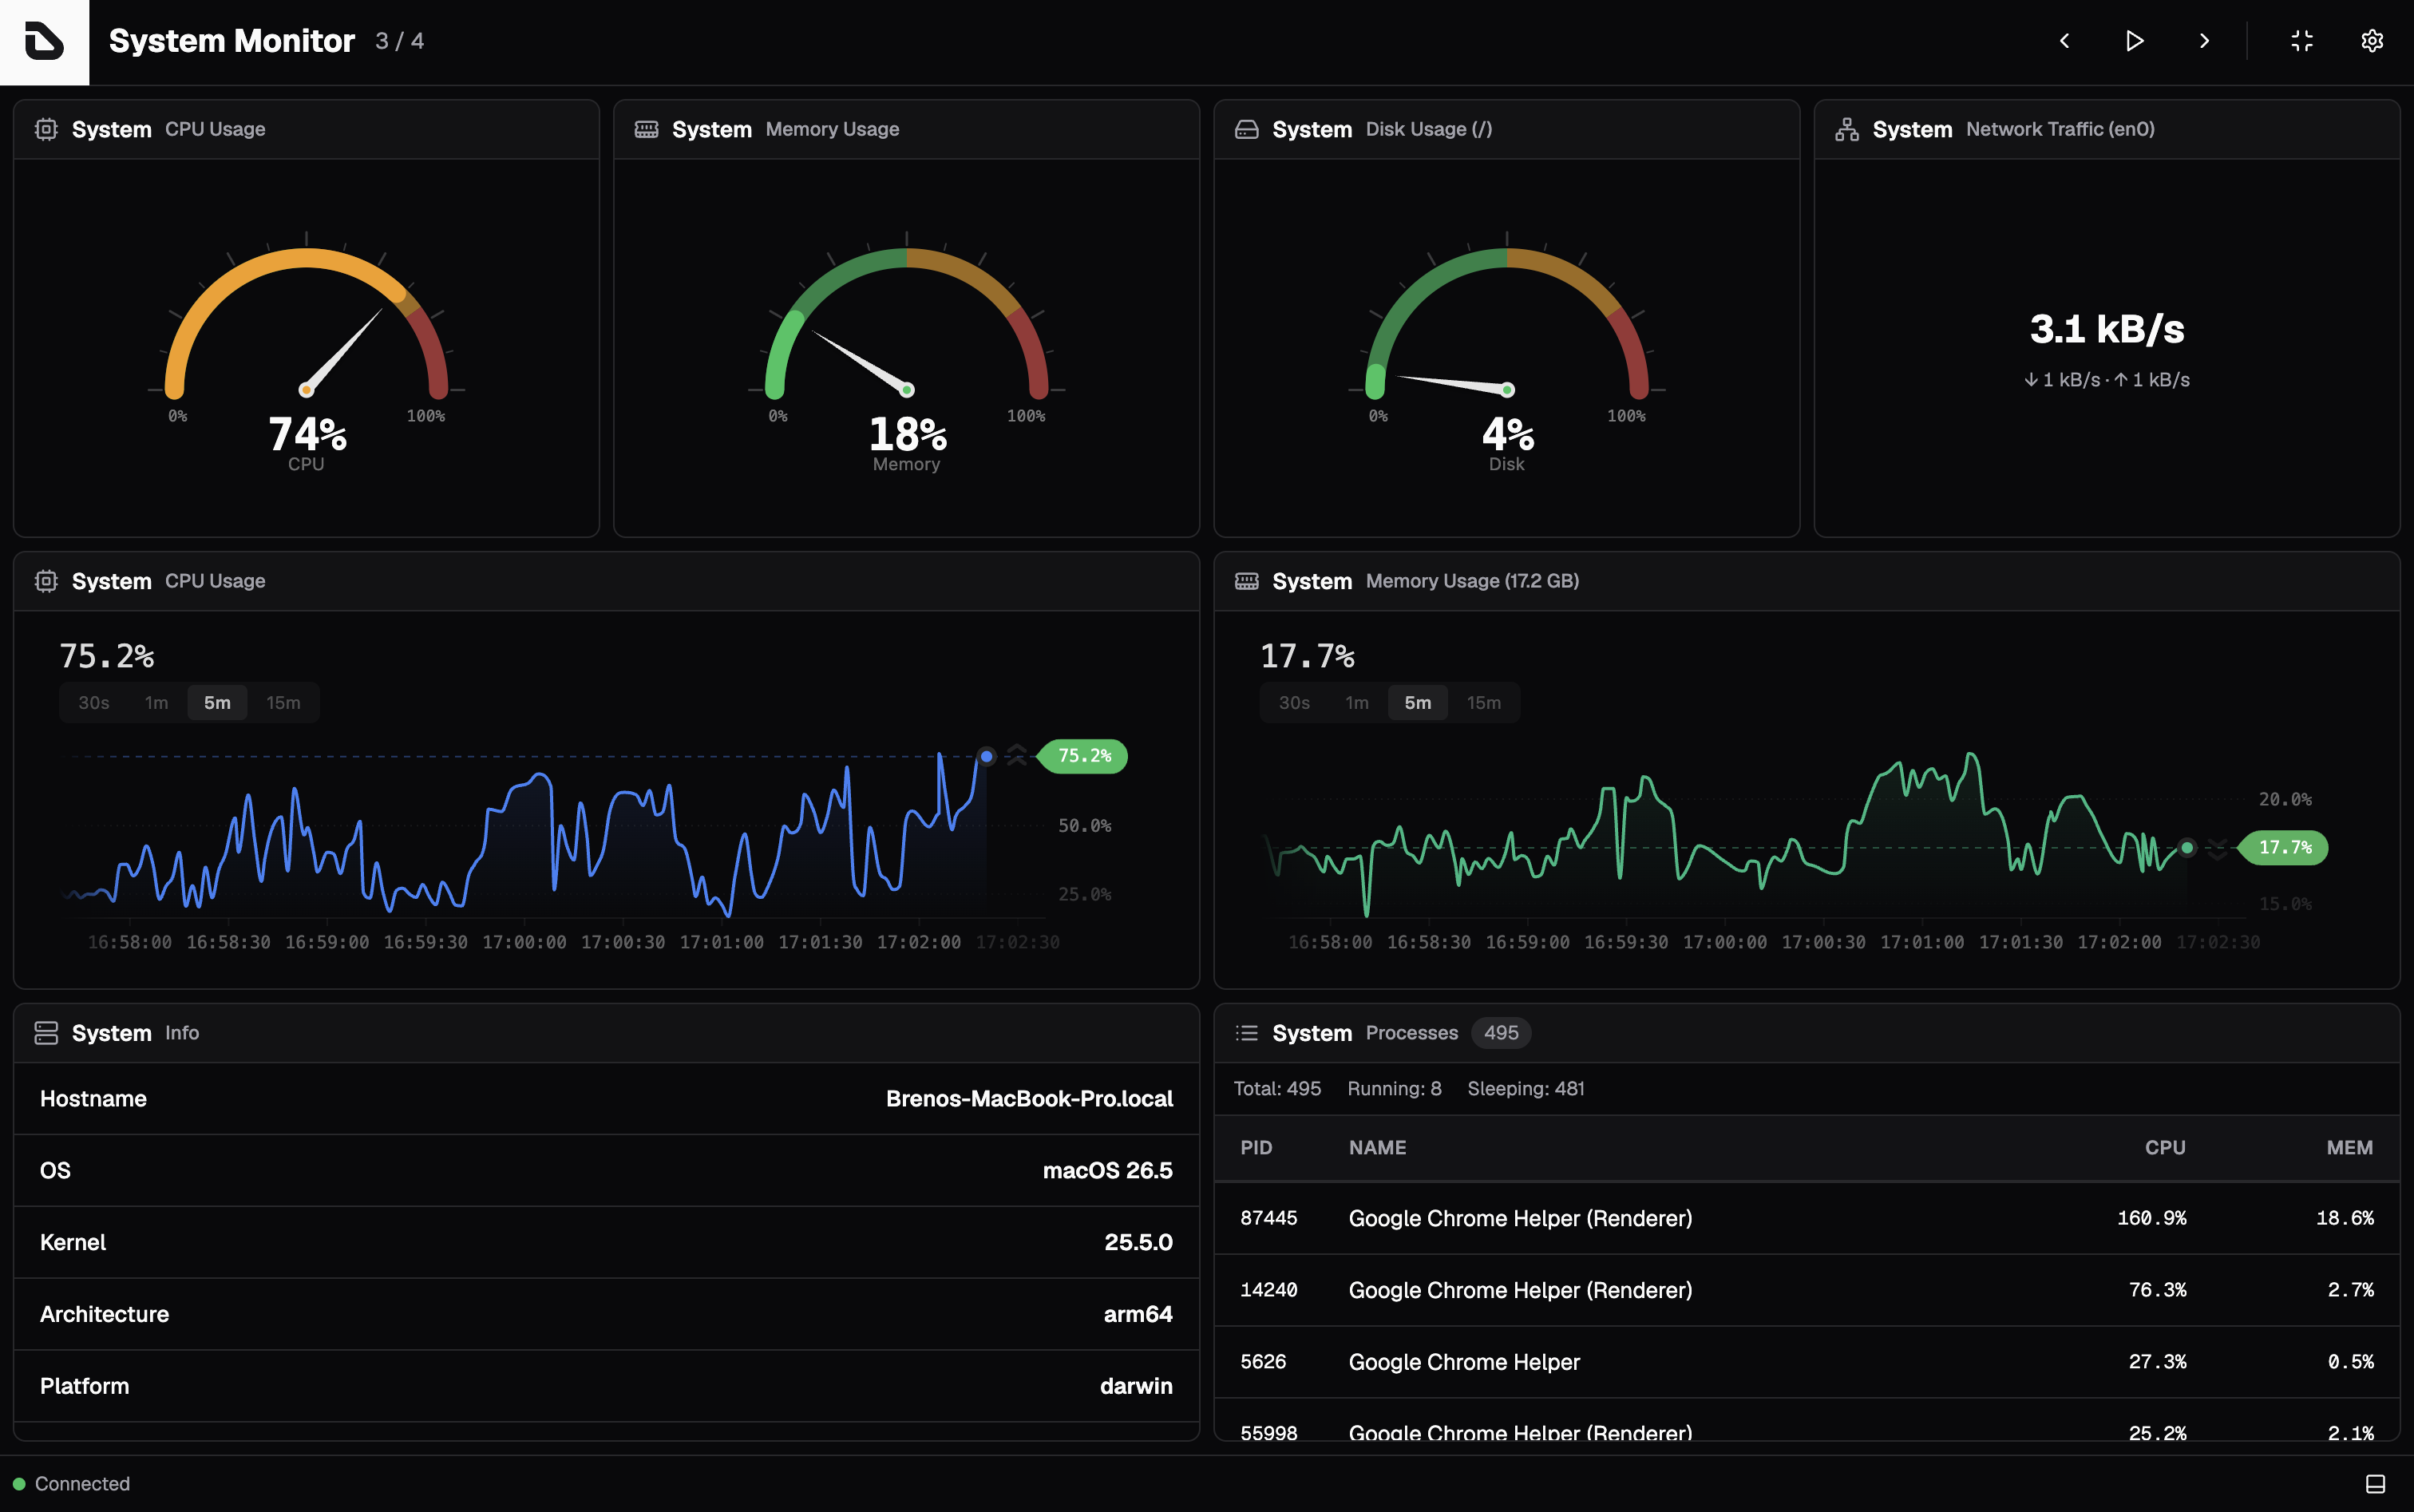
- 🖥️ CPU monitoring: Real-time CPU usage with per-core breakdown and temperature
- 🧠 Memory tracking: RAM and swap usage with detailed breakdown
- 💾 Disk usage: Filesystem usage per mount point with progress bars
- 🌐 Network stats: Interface status, bytes transferred, and current speed
- 📋 Process list: Top processes sorted by CPU or memory usage
- 🔧 System info: Hostname, OS, CPU model, uptime, and hardware details
- 📈 Gauges & live charts: Radial gauges and animated line charts for every metric
- ⚡ Real-time updates: Push-mode updates at a configurable interval
- 🎨 Theme support: Works with all Dashfy themes (light/dark mode)
Install with your favorite package manager:
npm install @getdashfy/ext-systempnpm add @getdashfy/ext-systemyarn add @getdashfy/ext-systembun add @getdashfy/ext-systemThe package has two entry points. @getdashfy/ext-system holds the browser-safe React widgets, and @getdashfy/ext-system/client holds the server-only API client. Keeping them apart is what stops the Node-only systeminformation package from being bundled into your browser code, so always import the client from the /client subpath.
Register the System API client in your Dashfy server (dashfy.server.ts) using push mode:
import { Dashfy } from '@getdashfy/server'
import { createSystemClient } from '@getdashfy/ext-system/client'

// Create a new Dashfy server instance
const dashfy = new Dashfy()

// Load dashboard configuration
await dashfy.configureFromFile('./dashfy.config.yml')

// Register System API with push mode for real-time updates
dashfy.registerApi(
  'system',
  createSystemClient({
    pushInterval: 2000, // Update every 2 seconds
  }),
  'push',
)

// Start server
await dashfy.start()
Important: the third argument must be
'push'. The client throws if it is registered in poll mode.
Register System widgets in your React application (App.tsx):
import { WidgetRegistry } from '@getdashfy/ui'
import {
  CpuUsage,
  CpuUsageGauge,
  CpuUsageLine,
  DiskUsage,
  DiskUsageGauge,
  MemoryUsage,
  MemoryUsageGauge,
  MemoryUsageLine,
  NetworkStats,
  NetworkStatsCompact,
  NetworkStatsLine,
  Processes,
  SystemInfo,
} from '@getdashfy/ext-system'

// Register System extension
WidgetRegistry.addExtension('system', {
  CpuUsage,
  CpuUsageGauge,
  CpuUsageLine,
  DiskUsage,
  DiskUsageGauge,
  MemoryUsage,
  MemoryUsageGauge,
  MemoryUsageLine,
  NetworkStats,
  NetworkStatsCompact,
  NetworkStatsLine,
  Processes,
  SystemInfo,
})Add System widgets to your dashboard configuration (dashfy.config.yml):
dashboards:
  - title: System Monitor
    columns: 3
    rows: 2
    widgets:
      - extension: system
        widget: CpuUsage
        showCores: true
        x: 0
        y: 0
        columns: 1
        rows: 1

      - extension: system
        widget: MemoryUsage
        x: 1
        y: 0
        columns: 1
        rows: 1

      - extension: system
        widget: DiskUsage
        x: 2
        y: 0
        columns: 1
rows: 1This extension uses push mode. In poll mode the Bus controls timing for every API at once, while in push mode each endpoint runs its own interval, which suits fast-changing metrics like CPU and memory. Intervals only run while a widget is subscribed.
createSystemClient({
  // Maximum number of processes to return, sorted by CPU usage
  processLimit: 10, // default

  // Push interval in milliseconds (how often to send updates)
  pushInterval: 2000, // default (2 seconds)
})createSystemClient registers the endpoints below. Widgets subscribe to them through the endpoint parameter, and you can call any of them from your own custom widgets.
| Endpoint | Parameters | Returns |
|---|---|---|
systemInfo |
- | CPU model, OS, hardware, hostname, and uptime |
cpuUsage |
- | Current load per core and CPU temperature |
memoryUsage |
- | RAM and swap usage |
diskUsage |
- | Filesystem usage per mount point |
networkStats |
- | Network interfaces and traffic counters |
processes |
limit, sortBy |
Top processes by CPU or memory |
battery |
- | Battery level, charging state, and cycles |
battery has no built-in widget yet — it is available for custom widgets.
Display current CPU usage with an overall load bar and optional per-core breakdown.
Parameters:
| Parameter | Type | Required | Default | Description |
|---|---|---|---|---|
showCores |
boolean | no | false | Show per-core usage bars |
showTemperature |
boolean | no | true | Show CPU temperature |
title |
string | no | "System" | Custom widget title |
subject |
string | no | "CPU Usage" | Custom widget subject |
api |
string | no | "system" | API subscription ID |
endpoint |
string | no | "cpuUsage" | API endpoint to call |
Example:
- extension: system
  widget: CpuUsage
  showCores: true
  showTemperature: true
  columns: 1
rows: 1Display CPU usage as a radial gauge chart with color-coded status.
Parameters:
| Parameter | Type | Required | Default | Description |
|---|---|---|---|---|
tickLabels |
boolean | no | false | Show gauge tick labels |
title |
string | no | "System" | Custom widget title |
subject |
string | no | "CPU Usage" | Custom widget subject |
api |
string | no | "system" | API subscription ID |
endpoint |
string | no | "cpuUsage" | API endpoint to call |
Example:
- extension: system
  widget: CpuUsageGauge
  columns: 1
rows: 1Display CPU usage as a real-time animated line chart.
Parameters:
| Parameter | Type | Required | Default | Description |
|---|---|---|---|---|
showWindows |
boolean | no | true | Show time window buttons (30s-15m) |
title |
string | no | "System" | Custom widget title |
subject |
string | no | "CPU Usage" | Custom widget subject |
api |
string | no | "system" | API subscription ID |
endpoint |
string | no | "cpuUsage" | API endpoint to call |
Example:
- extension: system
  widget: CpuUsageLine
  showWindows: true
  columns: 2
rows: 1Display current memory (RAM) usage with a progress bar and detailed breakdown.
Parameters:
| Parameter | Type | Required | Default | Description |
|---|---|---|---|---|
showSwap |
boolean | no | true | Show swap memory info |
title |
string | no | "System" | Custom widget title |
subject |
string | no | "Memory Usage" | Custom widget subject |
api |
string | no | "system" | API subscription ID |
endpoint |
string | no | "memoryUsage" | API endpoint to call |
Example:
- extension: system
  widget: MemoryUsage
  showSwap: true
  columns: 1
rows: 1Display memory usage as a radial gauge chart with color-coded status.
Parameters:
| Parameter | Type | Required | Default | Description |
|---|---|---|---|---|
tickLabels |
boolean | no | false | Show gauge tick labels |
title |
string | no | "System" | Custom widget title |
subject |
string | no | "Memory Usage" | Custom widget subject |
api |
string | no | "system" | API subscription ID |
endpoint |
string | no | "memoryUsage" | API endpoint to call |
Example:
- extension: system
  widget: MemoryUsageGauge
  columns: 1
rows: 1Display memory usage as a real-time animated line chart.
Parameters:
| Parameter | Type | Required | Default | Description |
|---|---|---|---|---|
showWindows |
boolean | no | true | Show time window buttons (30s-15m) |
title |
string | no | "System" | Custom widget title |
subject |
string | no | "Memory Usage" | Custom widget subject |
api |
string | no | "system" | API subscription ID |
endpoint |
string | no | "memoryUsage" | API endpoint to call |
Example:
- extension: system
  widget: MemoryUsageLine
  showWindows: true
  columns: 2
rows: 1Display filesystem usage with progress bars per mount point.
Parameters:
| Parameter | Type | Required | Default | Description |
|---|---|---|---|---|
title |
string | no | "System" | Custom widget title |
subject |
string | no | "Disk Usage" | Custom widget subject |
api |
string | no | "system" | API subscription ID |
endpoint |
string | no | "diskUsage" | API endpoint to call |
Example:
- extension: system
  widget: DiskUsage
  columns: 1
rows: 1Display disk usage as a radial gauge chart with color-coded status.
Parameters:
| Parameter | Type | Required | Default | Description |
|---|---|---|---|---|
mount |
string | no | first mount | Mount point to display (e.g. /) |
tickLabels |
boolean | no | false | Show gauge tick labels |
title |
string | no | "System" | Custom widget title |
subject |
string | no | "Disk Usage" | Custom widget subject |
api |
string | no | "system" | API subscription ID |
endpoint |
string | no | "diskUsage" | API endpoint to call |
Example:
- extension: system
  widget: DiskUsageGauge
  mount: /
  columns: 1
rows: 1Display network interface stats including bytes transferred and current speed.
Parameters:
| Parameter | Type | Required | Default | Description |
|---|---|---|---|---|
title |
string | no | "System" | Custom widget title |
subject |
string | no | "Network" | Custom widget subject |
api |
string | no | "system" | API subscription ID |
endpoint |
string | no | "networkStats" | API endpoint to call |
Example:
- extension: system
  widget: NetworkStats
  columns: 1
rows: 1Display combined network traffic (RX + TX) in a compact view.
Parameters:
| Parameter | Type | Required | Default | Description |
|---|---|---|---|---|
interface |
string | no | first active | Network interface (e.g. en0, eth0) |
title |
string | no | "System" | Custom widget title |
subject |
string | no | "Network Traffic" | Custom widget subject |
api |
string | no | "system" | API subscription ID |
endpoint |
string | no | "networkStats" | API endpoint to call |
Example:
- extension: system
  widget: NetworkStatsCompact
  interface: en0
  columns: 1
rows: 1Display network traffic (RX/TX) as a real-time multi-series animated line chart.
Parameters:
| Parameter | Type | Required | Default | Description |
|---|---|---|---|---|
interface |
string | no | first active | Network interface (e.g. en0, eth0) |
showWindows |
boolean | no | true | Show time window buttons (30s-15m) |
title |
string | no | "System" | Custom widget title |
subject |
string | no | "Network Traffic" | Custom widget subject |
api |
string | no | "system" | API subscription ID |
endpoint |
string | no | "networkStats" | API endpoint to call |
Example:
- extension: system
  widget: NetworkStatsLine
  interface: en0
  showWindows: true
  columns: 2
rows: 1Display top processes sorted by CPU or memory usage.
Parameters:
| Parameter | Type | Required | Default | Description |
|---|---|---|---|---|
limit |
number | no | 10 | Max processes to display |
sortBy |
"cpu" | "mem" | no | "cpu" | Sort by CPU or memory usage |
title |
string | no | "System" | Custom widget title |
subject |
string | no | "Processes" | Custom widget subject |
api |
string | no | "system" | API subscription ID |
endpoint |
string | no | "processes" | API endpoint to call |
Example:
- extension: system
  widget: Processes
  limit: 15
  sortBy: cpu
  columns: 2
rows: 1Display static system information: hostname, OS, CPU model, uptime, and hardware details.
Parameters:
| Parameter | Type | Required | Default | Description |
|---|---|---|---|---|
title |
string | no | "System" | Custom widget title |
subject |
string | no | "Info" | Custom widget subject |
api |
string | no | "system" | API subscription ID |
endpoint |
string | no | "systemInfo" | API endpoint to call |
Example:
- extension: system
  widget: SystemInfo
  columns: 1
rows: 1systeminformation backs every endpoint, so platform coverage follows its own:
- macOS: Full support including CPU temperature (via powermetrics)
- Linux: Full support including CPU temperature
- Windows: Full support (some features may require admin privileges)
- FreeBSD/OpenBSD: Partial support
Note: CPU temperature is not available on all systems. When unavailable, the widget displays "N/A".
Solution: CPU temperature is not available on all hardware. On macOS it may require running the server with elevated privileges. On Linux, ensure lm-sensors is installed.
Solution: Increase pushInterval (for example 3000ms or 5000ms) or reduce the number of system widgets on the dashboard.
Solution: Only active ("up") interfaces are displayed. Ensure your interfaces are connected.
Solution: Some environments restrict process listing. Ensure the Dashfy server has permission to read process information.
Solution: Pass 'push' as the third argument to registerApi. This client has no poll-mode fallback.
Contributions are welcome. For issues and pull requests related to the extension, use the dashfy/dashfy-ext-system repository. Framework contributions belong in dashfy/dashfy.
Join the community on Dashfy's Discord server to discuss the project, ask questions, or get help.
Join the conversation on X (Twitter) and follow @dashfydev for updates and announcements.
This project is licensed under the AGPL-3.0 License - see the LICENSE file for details.