


Proxy Monitor is a web application designed to work exclusively with the Squid-Cache proxy server and requires the Apache2 web server. It reads traffic information from Squid's access.log to generate detailed statistics and usage reports for the local network. Use the tabs at the top of the dashboard to access each analysis module.
|
Proxy Monitor es una aplicación web diseñada para funcionar exclusivamente con el servidor proxy Squid-Cache y requiere el servidor web Apache2. Obtiene la información de tráfico desde el archivo access.log de Squid para generar estadísticas detalladas e informes de uso de la red local. Utilice las pestañas en la parte superior del panel para acceder a cada módulo de análisis.
|
git clone --depth=1 https://github.com/maravento/proxymon.git
cd proxymon
sudo bash proxymon.sh| OS | CPU | RAM | Storage | Dependencies |
|---|---|---|---|---|
| Ubuntu 24.04.x | Intel Core i5/Xeon/AMD Ryzen 5 (≥ 3.0 GHz) | 16 GB | 2 GB SSD | Squid Cache v6.13, Apache v2.4.58, PHP 8.3.6 |
proxymon.sh checks that Squid, Apache, PHP, and a set of supporting packages
are installed before proceeding, but it does not install them for you —
installation aborts with a list of missing packages if any of this hasn't
been done first.
# other required packages (checked by proxymon.sh, no extra setup needed)
apt install -y wget git rsync ipset nbtscan libcgi-session-perl libgd-perl \
                coreutils sarg fonts-lato fonts-liberation fonts-dejavu

# squid
apt install -y squid-openssl squid-langpack squid-common squidclient squid-purge
mkdir -p /var/log/squid &>/dev/null
touch /var/log/squid/{access,cache,store,deny}.log &>/dev/null
chown proxy:proxy /var/log/squid/*.log
chmod 640 /var/log/squid/*.log
for cache_type in rock ufs; do
    mkdir -p /var/spool/squid/${cache_type} 2>/dev/null
done
chown -R proxy:proxy /var/spool/squid
chmod -R 700 /var/spool/squid
usermod -aG proxy www-data
systemctl enable squid.service
squid -z
cp -f /etc/logrotate.d/squid{,.bak} &>/dev/null
sed -i '/sharedscripts/a \    create 0644 proxy proxy' /etc/logrotate.d/squid
sed -i 's/rotate 2/rotate 7/' /etc/logrotate.d/squid
sed -i 's/^	daily$/	monthly/' /etc/logrotate.d/squid

# php
apt install -y php libapache2-mod-php php-cli php-curl
# Detect PHP version
if command -v php &>/dev/null; then
    PHP_VERSION=$(php -r "echo PHP_MAJOR_VERSION.'.'.PHP_MINOR_VERSION;" 2>/dev/null)
    echo "PHP version detected: $PHP_VERSION"
else
    echo "Error: PHP not installed"
    exit 1
fi
# Ensure php.ini exists for Apache
if [ ! -f /etc/php/$PHP_VERSION/apache2/php.ini ]; then
    if [ -f /etc/php/$PHP_VERSION/cli/php.ini ]; then
        mkdir -p /etc/php/$PHP_VERSION/apache2
        cp /etc/php/$PHP_VERSION/cli/php.ini /etc/php/$PHP_VERSION/apache2/php.ini
        echo "php.ini copied to /etc/php/$PHP_VERSION/apache2/"
    else
        echo "Error: php.ini not found"
        exit 1
    fi
fi
cp -f /etc/php/$PHP_VERSION/apache2/php.ini{,.bak} &>/dev/null
sed -i \
  -e 's/^\s*;*\s*max_execution_time\s*=.*/max_execution_time = 120/' \
  -e 's/^\s*max_input_time\s*=.*/max_input_time = 120/' \
  -e 's/^;\s*max_input_time\s*=.*/max_input_time = 120/' \
  -e 's/^\s*memory_limit\s*=.*/memory_limit = 1024M/' \
  -e 's/^\s*post_max_size\s*=.*/post_max_size = 64M/' \
  -e 's/^\s*upload_max_filesize\s*=.*/upload_max_filesize = 64M/' \
  -e 's/^\s*;*\s*opcache.memory_consumption\s*=.*/opcache.memory_consumption = 256/' \
  -e 's/^\s*;*\s*realpath_cache_size\s*=.*/realpath_cache_size = 16M/' \
  /etc/php/$PHP_VERSION/apache2/php.ini

# apache
apt install -y apache2 apache2-doc apache2-utils apache2-dev \
                apache2-suexec-pristine libaprutil1t64 libaprutil1-dev \
                libtest-fatal-perl
systemctl enable apache2.service
apt -qq install -y --reinstall apache2-doc
cp -f /etc/apache2/mods-available/mpm_prefork.conf{,.bak} &>/dev/null
sed -i \
  -e 's/^\(StartServers[[:space:]]*\)5/\110/' \
  -e 's/^\(MinSpareServers[[:space:]]*\)5/\110/' \
  -e 's/^\(MaxSpareServers[[:space:]]*\)10/\115/' \
  -e 's/^\(MaxRequestWorkers[[:space:]]*\)150/\1200/' \
  -e 's/^\(MaxConnectionsPerChild[[:space:]]*\)0/\11000/' \
  /etc/apache2/mods-available/mpm_prefork.conf
# Enable modules
a2dismod -q mpm_event || true
a2enmod -q mpm_prefork || true
a2enmod -q php || true| - If any IP addresses on your local network do not go through the Squid proxy, then they will not appear in the reports. | - Si alguna dirección IP de su red local no pasan por el proxy Squid, entonces no aparecerá en los reportes. |
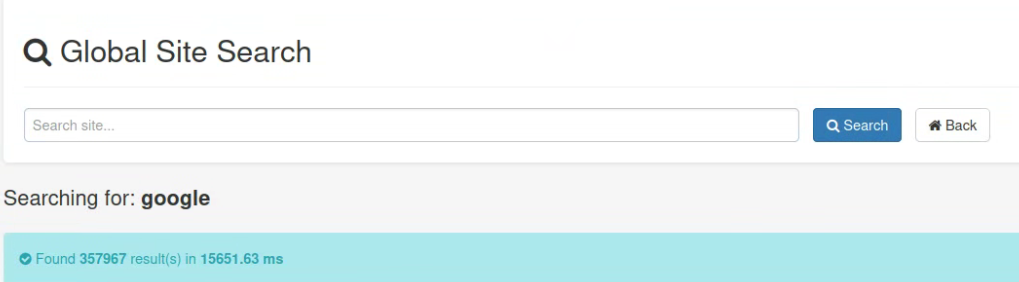
| - The results shown in Squidmon Search and Traffic Search are examples and may vary depending on your environment, dataset size, historical data volume, and computational resources available for ACL processing. | - Los resultados mostrados en Squidmon Search y Traffic Search son ejemplos y pueden variar según tu entorno, tamaño del conjunto de datos, volumen de datos históricos y recursos computacionales disponibles para el procesamiento de ACLs. |
# Proxy Monitor module installation/update/uninstallation script
#
# Description:
#   This script installs, updates, or uninstalls the Proxy Monitor application.
#   Proxy Monitor provides traffic monitoring and reporting for Squid proxy servers
#   with Squidmon, LightSquid, SARG, Sqstat and Squid Analyzer modules.
#
# Features:
# - LightSquid traffic reporting module (fast reports, per-user statistics, and daily/monthly traffic)
# - SQStat for real-time monitoring
# - SARG report generator (detailed and customizable reports)
# - SquidAnalyzer log analysis module (graphical traffic statistics and usage trends)
# - Bandata script for bandwidth control, usage limits, and quota management (integrated with LightSquid)
#   Configuration: /etc/proxymon/proxymon.env — automatically syncs quota values to the warning portal
# - Squidmon statistics module (advanced statistics, report printing, and ACL-driven operations)
# - Warning portal for quota limit notifications
# - Automatic dependency checking
# - Crontab task management
# - Apache virtual host configuration
#
# Usage:
#   sudo ./proxymon.sh [OPTIONS]
#
# Options:
#   install      Install Proxy Monitor
#   update       Update Proxy Monitor code (/var/www/proxymon only)
#   uninstall    Uninstall Proxy Monitor
#   -h, --help   Show help message
#
# Examples:
#   sudo ./proxymon.sh              # Interactive menu
#   sudo ./proxymon.sh install      # Direct installation
#   sudo ./proxymon.sh update       # Direct update
#   sudo ./proxymon.sh uninstall    # Direct uninstallation
install writes everything from scratch (Apache vhosts, proxymon.env, ACL lists, SARG/PHP/Apache hardening, cron). To avoid overwriting a working setup or prompting over one, it refuses to run if /var/www/proxymon already exists — use update or uninstall first.
update only refreshes code and permissions under /var/www/proxymon. It never touches Apache/PHP/SARG system config, cron, ACL lists, or proxymon.env, and it never prompts. Sequence: stop Apache → back up live data to ~<local_user>/proxymonbak/<timestamp>/ (a real folder, never /tmp) → replace code → restore live data from that backup → reset permissions → restart Apache. Each run's backup is timestamped and kept (never auto-deleted), so past backups accumulate as a safety net. Live data preserved this way:
|
install escribe todo desde cero (vhosts de Apache, proxymon.env, listas ACL, hardening de SARG/PHP/Apache, cron). Para no sobrescribir una instalación en funcionamiento ni pedir datos sobre ella, se detiene si /var/www/proxymon ya existe — use update o uninstall primero.
update solo refresca el código y los permisos dentro de /var/www/proxymon. Nunca toca la configuración de Apache/PHP/SARG, el cron, las listas ACL, ni proxymon.env, y nunca pide datos. Secuencia: detiene Apache → respalda los datos vivos en ~<local_user>/proxymonbak/<fecha>/ (una carpeta real, nunca /tmp) → reemplaza el código → restaura los datos vivos desde ese respaldo → reestablece permisos → reinicia Apache. Cada corrida queda con su propio respaldo con fecha (nunca se borra solo), acumulando historial como red de seguridad. Datos vivos preservados de esta forma:
|
| Path | Description | Descripción |
|---|---|---|
lightsquid/report |
Daily LightSquid reports | Reportes diarios de LightSquid |
lightsquid/realname.cfg |
Hostname mappings | Mapeo de hostnames |
lightsquid/skipuser.cfg |
Excluded users | Usuarios excluidos |
sarg/squid-reports |
SARG rendered reports | Reportes generados por SARG |
squidmon/etc/config |
SquidMon config file | Archivo de configuración de SquidMon |
squidanalyzer/output |
SquidAnalyzer rendered reports | Reportes generados por SquidAnalyzer |
sqstat/config.inc.php |
SQStat custom config (e.g. cachemgr credentials) | Config personalizada de SQStat (ej. credenciales de cachemgr) |
Access Proxymon: http://localhost:18080
Warning for Bandata: http://192.168.X.X:18081 (LAN-only, not reachable via localhost)

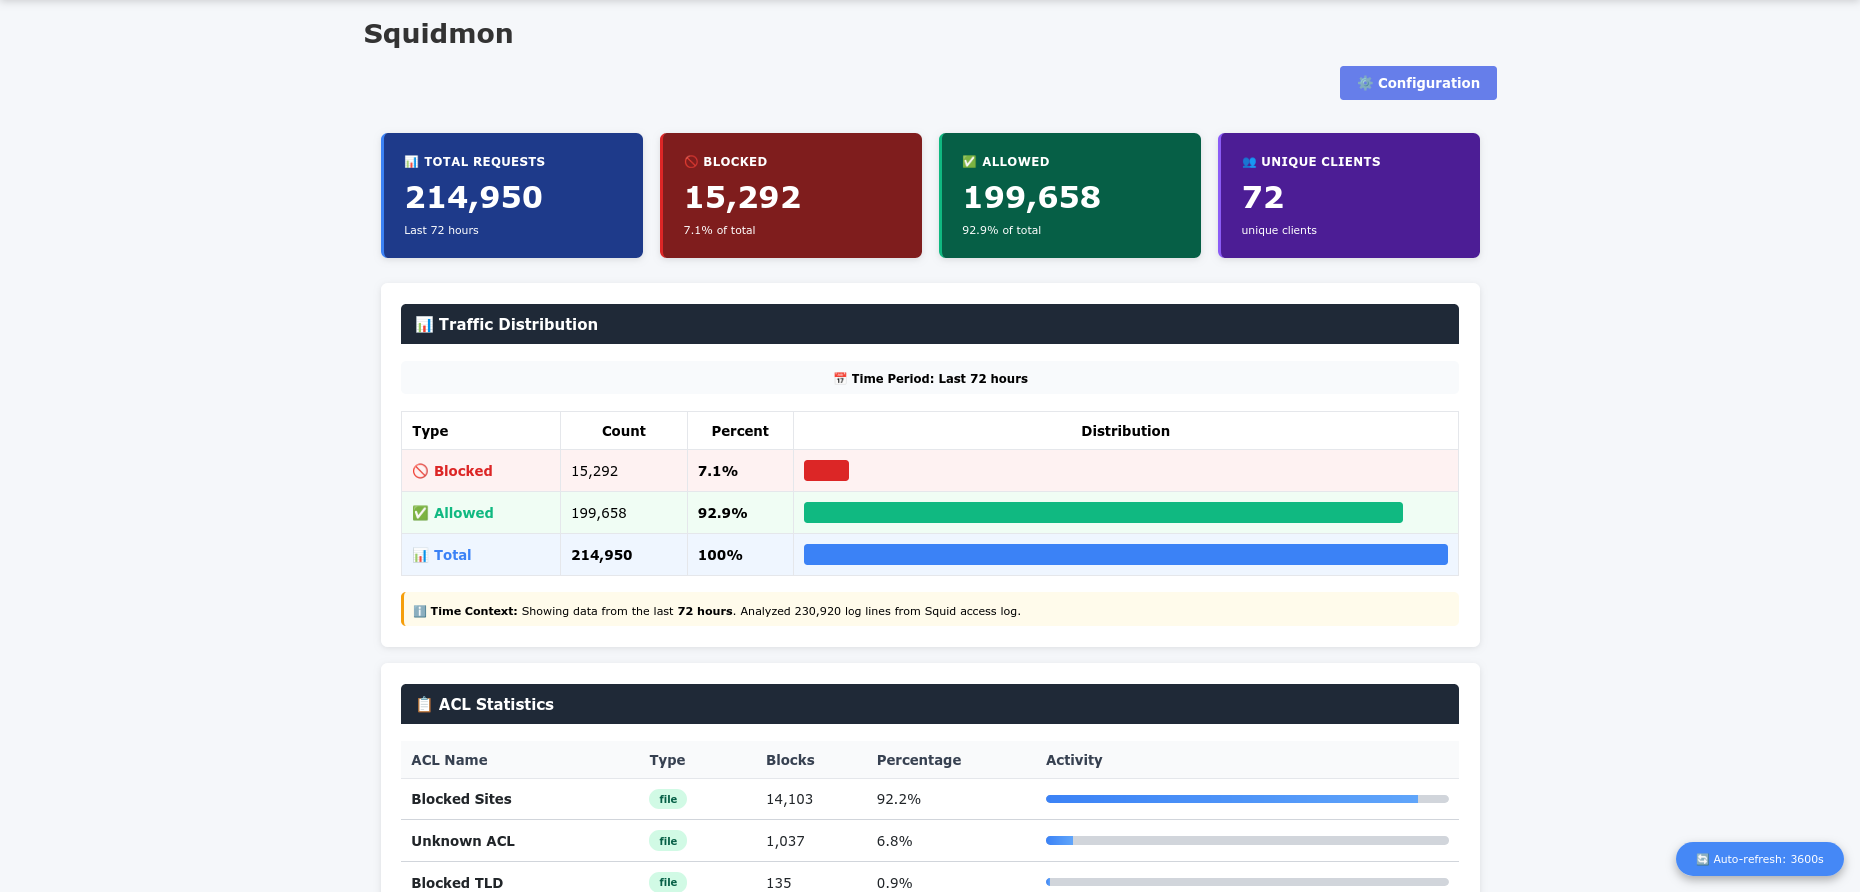
| Squid Monitor (squidmon) provides detailed real-time traffic analysis and monitoring of your Squid proxy. It displays comprehensive statistics including blocked domains, blocked clients, traffic patterns, and ACL matching information. The module allows you to monitor, filter, and generate detailed reports on network activity and content blocking. | Squid Monitor (squidmon) proporciona análisis de tráfico en tiempo real y monitoreo detallado de su proxy Squid. Muestra estadísticas completas incluyendo dominios bloqueados, clientes bloqueados, patrones de tráfico e información de coincidencia de ACL. El módulo permite monitorear, filtrar y generar reportes detallados sobre actividad de red y bloqueo de contenido. |
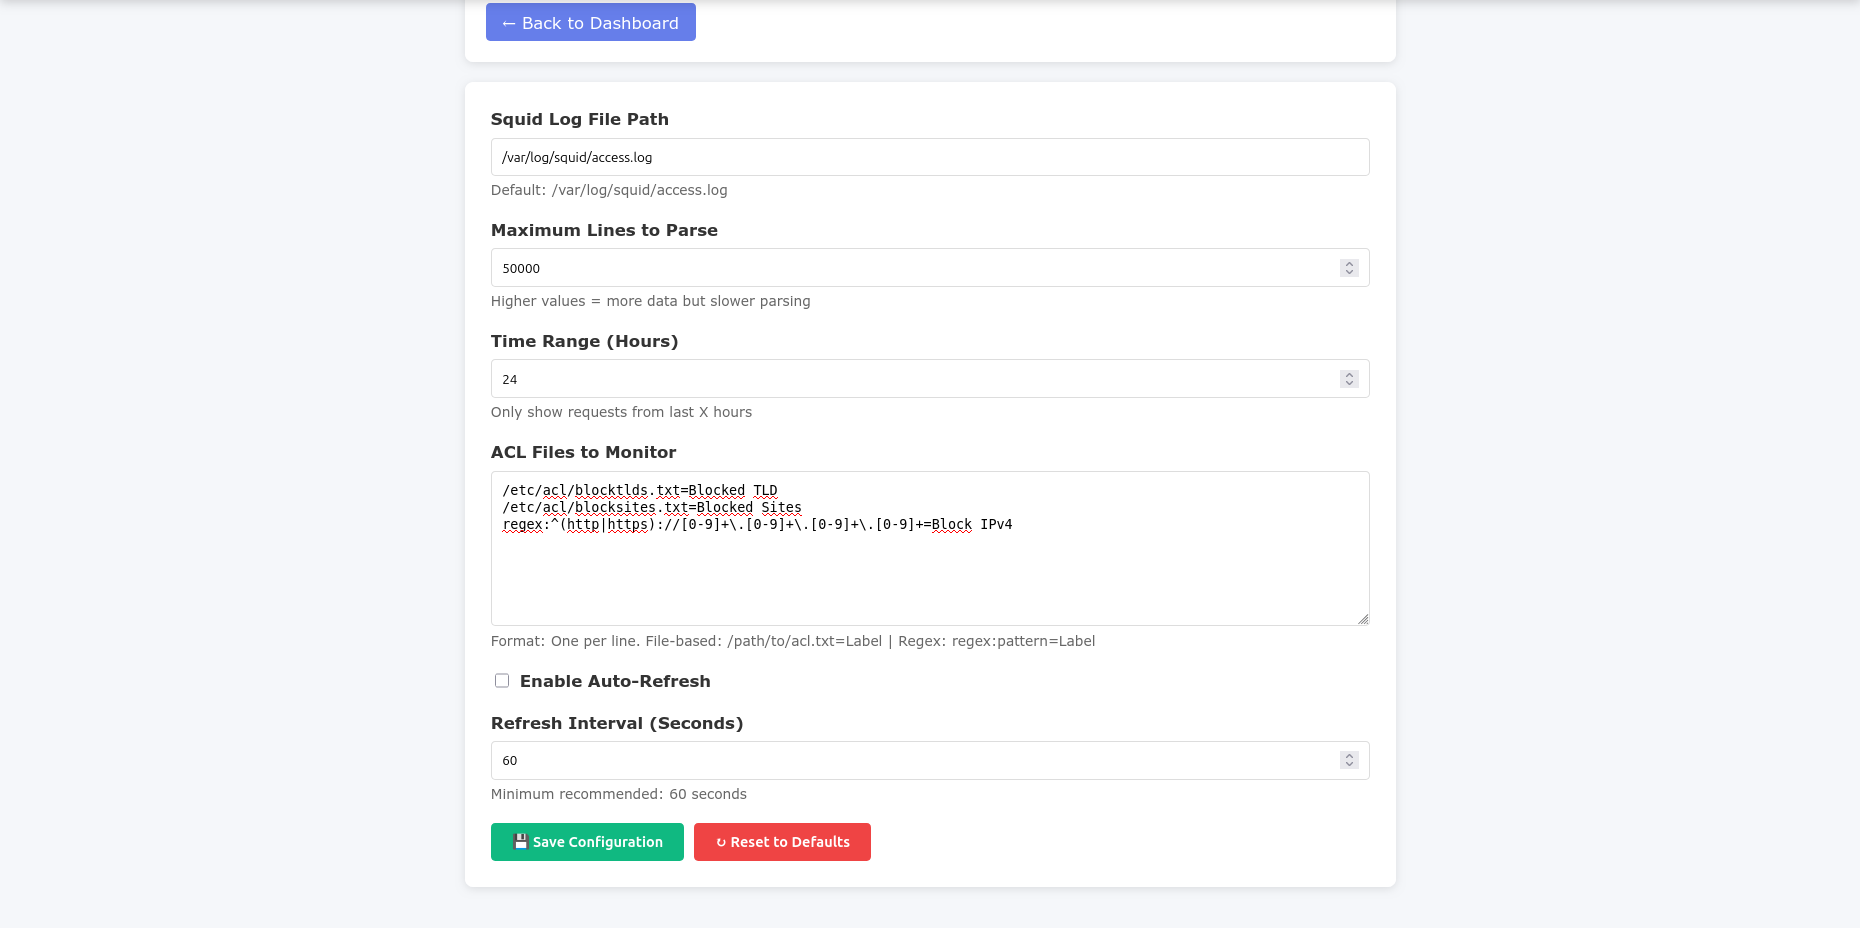
This section defines the parameters that Squid Monitor uses to interpret and display network activity, including data sources (access control lists —ACLs—), the maximum number of lines to analyze from the Squid log, the time range of the data, and the automatic refresh interval. The default path for ACLs is /etc/acl and the following lists are integrated:
|
Esta sección define los parámetros que Squid Monitor utiliza para interpretar y visualizar la actividad de la red, incluyendo las fuentes de datos (listas de control de acceso —ACLs—), el número máximo de líneas a analizar del registro de Squid, el rango temporal de los datos y la frecuencia de actualización automática. El path por defecto de las ACLs es /etc/acl y se integran las siguientes listas:
|
/etc/acl/acl_squid/blocktlds.txt=Blocked TLD
/etc/acl/acl_squid/blockdomains.txt=Blocked Domains
regex:^[0-9]{1,3}\.[0-9]{1,3}\.[0-9]{1,3}\.[0-9]{1,3}(:\d+)?=Block IPv4
To change the path and lists, modify this section of Config, as shown in the image above, and also change the path in the script bandata.sh.
|
Para cambiar el path y las listas, modifíquese en esta sección de Config, como se muestra en la imagen superior y cambie también el path en el script bandata.sh.
|
sudo nano /var/www/proxymon/tools/bandata.sh
# path to ACLs folder
acl_pacth=/etc/acl
squid.conf for blocking to take effect. Example for declaring default ACLs:
|
squid.conf para que surta efecto el bloqueo. Ejemplo para declarar las ACLs por defecto:
|
sudo nano /etc/squid/squid.conf
#
# INSERT YOUR OWN RULE(S) HERE TO ALLOW ACCESS FROM YOUR CLIENTS
#
include /etc/squid/conf.d/*.conf
# Block: TLDs
# For more information visit: https://github.com/maravento/blackweb
acl blocktlds dstdomain "/etc/acl/acl_squid/blocktlds.txt"
http_access deny workdays blocktlds
# Block: domains
acl blocksites dstdomain "/etc/acl/acl_squid/blockdomains.txt"
http_access deny workdays blockdomains|
|
|
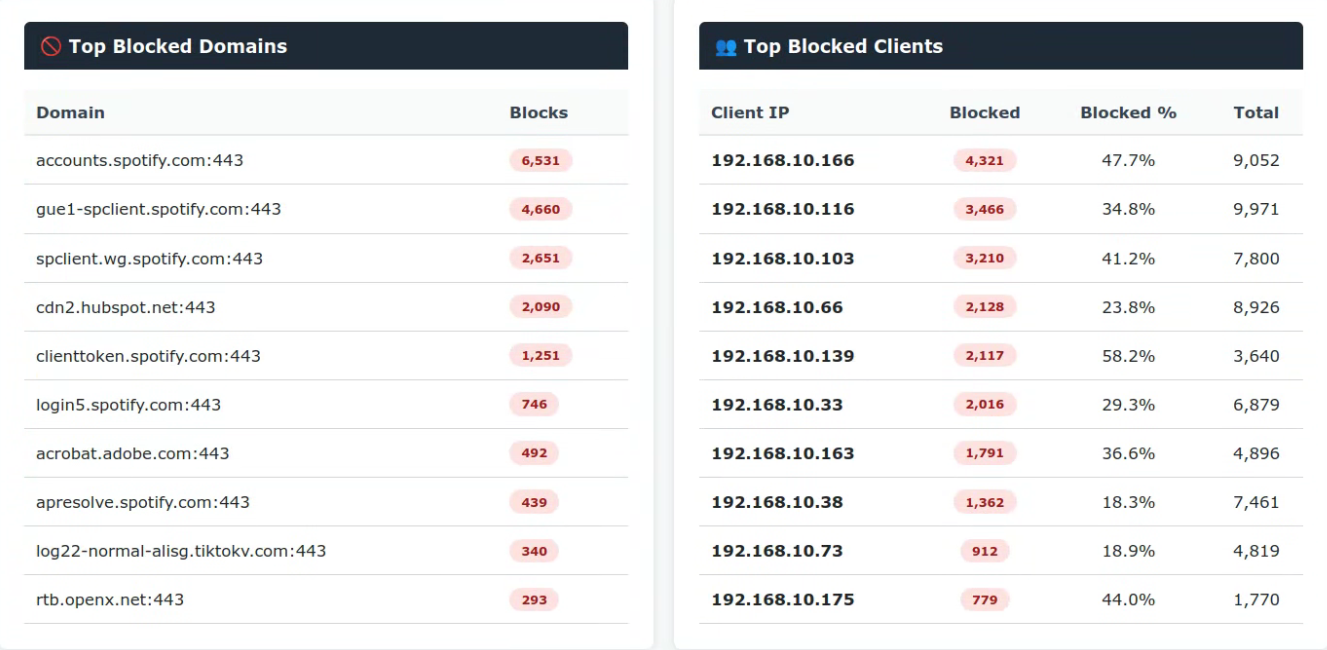
| Top Blocked Domains: Displays a list of the most frequently blocked domains on your network. Shows the domain name with port information and the total number of blocked requests for each domain. This helps identify which sites or services are being blocked most often and allows administrators to adjust blocking policies accordingly. | Top Blocked Domains: Muestra una lista de los dominios más bloqueados frecuentemente en su red. Muestra el nombre del dominio con información del puerto y el número total de solicitudes bloqueadas para cada dominio. Esto ayuda a identificar qué sitios o servicios se están bloqueando más frecuentemente y permite a los administradores ajustar las políticas de bloqueo en consecuencia. |
| Top Blocked Clients: Shows the client IP addresses with the highest number of blocked requests. Each entry displays the total requests made, blocked requests count, and the percentage of traffic that was blocked. This helps identify clients that frequently attempt to access restricted content and may require additional monitoring or bandwidth management. | Top Blocked Clients: Muestra las direcciones IP de los clientes con el mayor número de solicitudes bloqueadas. Cada entrada muestra el total de solicitudes realizadas, el conteo de solicitudes bloqueadas y el porcentaje del tráfico que fue bloqueado. Esto ayuda a identificar clientes que frecuentemente intentan acceder a contenido restringido y pueden requerir monitoreo adicional o gestión de ancho de banda. |
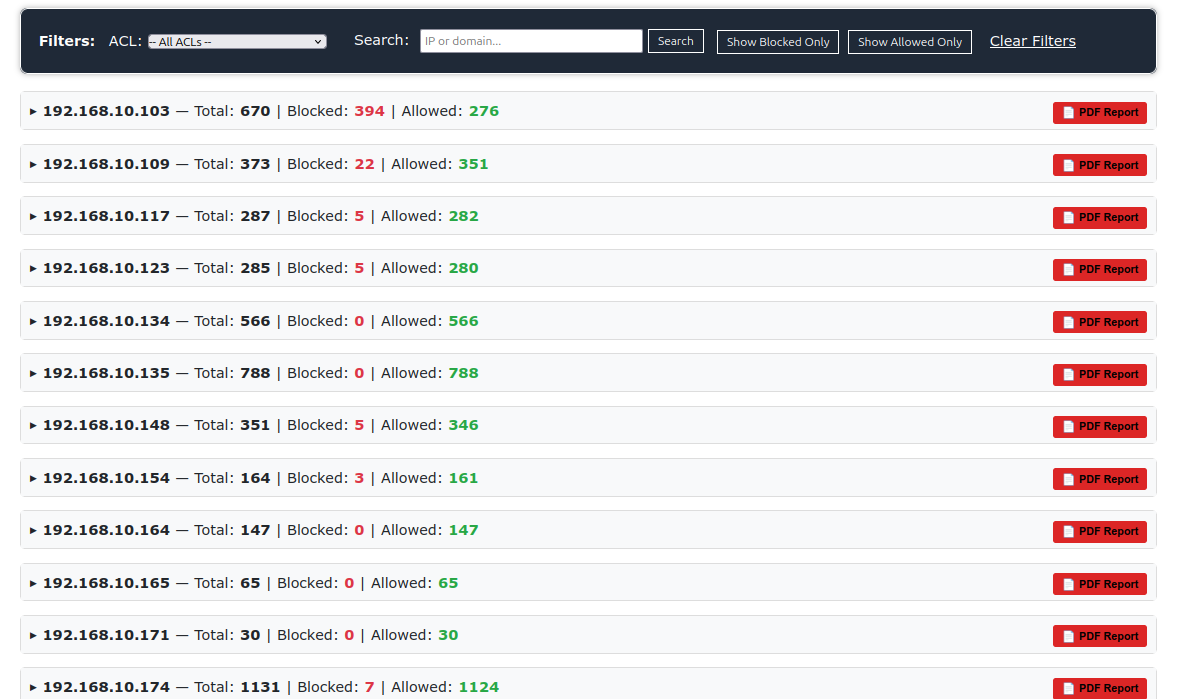
| Provides an expandable view of all client IP addresses and their traffic statistics. For each client, you can see total requests, blocked requests, and allowed requests. The module includes advanced filtering options with ACL selection, search functionality to find specific IPs or domains, and time range reports (Last 24 Hours, Last 7 Days, Last 30 Days). Individual PDF reports can be generated for each client's traffic. | Proporciona una vista expandible de todas las direcciones IP de clientes y sus estadísticas de tráfico. Para cada cliente, puede ver el total de solicitudes, solicitudes bloqueadas y solicitudes permitidas. El módulo incluye opciones de filtrado avanzadas con selección de ACL, funcionalidad de búsqueda para encontrar IPs o dominios específicos, y reportes de rango de tiempo (Últimas 24 Horas, Últimos 7 Días, Últimos 30 Días). Se pueden generar reportes PDF individuales para el tráfico de cada cliente. |
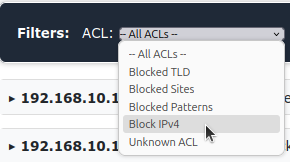
Squidmon provides powerful filtering capabilities, allowing you to classify traffic using ACLs (Access Control Lists) such as Blocked TLD, Blocked Sites, Blocked Patterns, Block IPv4, or Unknown ACL (any rule defined in squid.conf that is not listed in the ACLs specified in Config). It also includes a search tool to locate clients by IP address or identify domains by name, as well as the options Show Blocked Only and Show Allowed Only to display only blocked or allowed traffic. To return to the default view, you can use the Clean Filters button.
|
Squidmon ofrece potentes capacidades de filtrado, permitiendo clasificar el tráfico mediante ACLs (Access Control Lists) como Blocked TLD, Blocked Sites, Blocked Patterns, Block IPv4, o Unknown ACL (cualquier regla definida en squid.conf que no esté incluida en las ACLs especificadas en Config). También incluye una herramienta de búsqueda para localizar clientes por dirección IP o identificar dominios por nombre, así como las opciones Show Blocked Only y Show Allowed Only para visualizar únicamente el tráfico bloqueado o permitido. Para volver a la vista inicial, puede usar el botón Clean Filters.
|
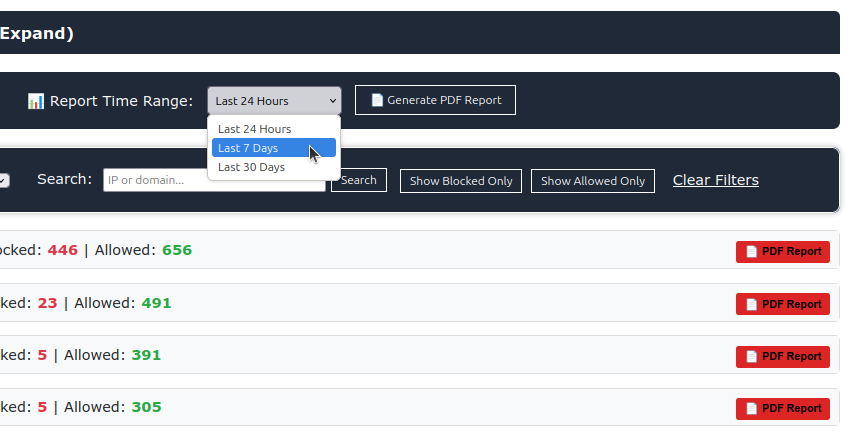
| Generate detailed PDF reports for traffic analysis and auditing purposes. Reports can be generated for specific time ranges including Last 24 Hours, Last 7 Days, or Last 30 Days. Each client or domain can have an individual PDF report created, making it easy to share traffic statistics with other administrators or stakeholders. The Generate PDF Report button is available throughout the interface. | Genere reportes PDF detallados para propósitos de análisis de tráfico y auditoría. Los reportes se pueden generar para rangos de tiempo específicos incluyendo Últimas 24 Horas, Últimos 7 Días o Últimos 30 Días. Se puede crear un reporte PDF individual para cada cliente o dominio, facilitando compartir estadísticas de tráfico con otros administradores o partes interesadas. El botón Generate PDF Report está disponible en toda la interfaz. |
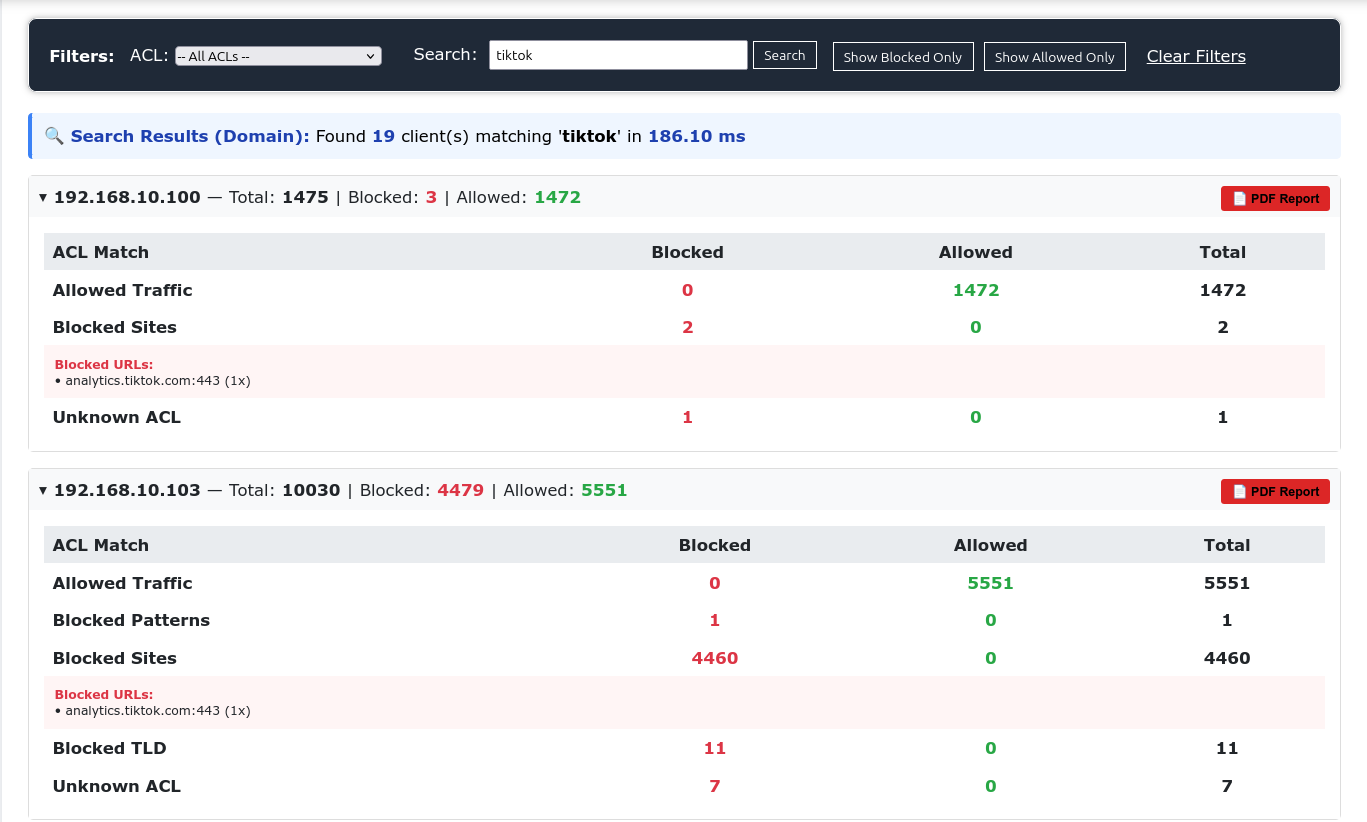
| When expanding a specific client IP, you can view detailed information about blocked URLs including the specific URLs that were blocked, the ACL rule that matched (e.g., Blocked Sites), and the number of times each URL was attempted. This granular level of detail helps identify problematic browsing patterns and allows for fine-tuning of access control policies. | Al expandir una IP de cliente específica, puede ver información detallada sobre URLs bloqueadas incluyendo las URLs específicas que fueron bloqueadas, la regla de ACL que coincidió (por ejemplo, Blocked Sites), y el número de veces que se intentó acceder a cada URL. Este nivel de detalle granular ayuda a identificar patrones de navegación problemáticos y permite afinar las políticas de control de acceso. |
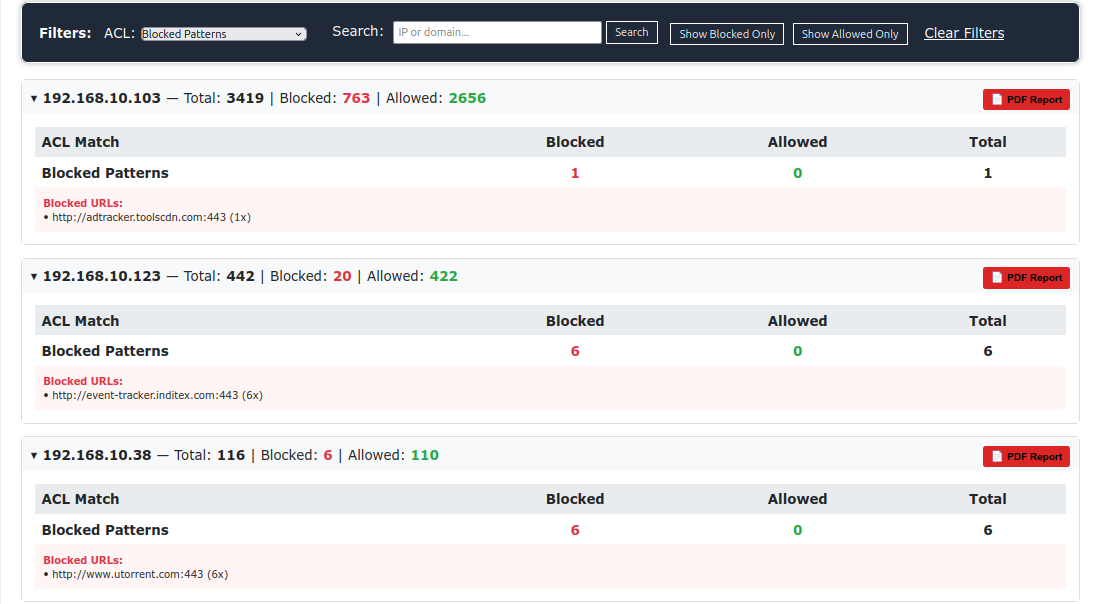
If you have an ACL in Squid-Cache that uses url_regex, you cannot declare its file path in the Squid Monitor configuration module; You must declare your content directly in the module settings. Example:
|
Si tiene una ACL en Squid-Cache que utiliza url_regex, no puede declarar su ruta de archivo en el módulo de configuración de Squid Monitor; debe declarar directamente su contenido en la configuración del módulo. Ejemplo:
|
regex:(announce\.php\?passkey=|Azureus|BitComet|BitLord|bittorrent|BitTorrent protocol|d1:ad2:id20:|find_node|get_peers|info_hash|iptv|jndi:|magnet:|nopor|\.onion|peer_id=|porn|psiphon|Shareaza|torrent|tracker|Transmission|ultrasurf|\.utorrent|XBT)=Blocked Patterns
regex:^[0-9]{1,3}\.[0-9]{1,3}\.[0-9]{1,3}\.[0-9]{1,3}(:\d+)?=Block IPv4
|
Result: 6 clients found in 0.08 seconds. Client IP-based filtering with domain resolution. Data Source: Squid access logs /var/log/squid/access.logSearch Method: Real-time log parsing with ACL filtering Use Case: Real-time client activity, immediate threat detection |
Resultado: 6 clientes encontrados en 0.08 s. Filtrado basado en IP del cliente con resolución de dominio. Fuente de Datos: Registros de acceso de Squid /var/log/squid/access.logMétodo de Búsqueda: Análisis de registros en tiempo real con filtrado ACL Caso de Uso: Actividad de cliente en tiempo real, detección inmediata de amenazas |
Squidmon reads only the current access.log file, not rotated files (access.log.0, access.log.1, access.log.gz, etc.). It's recommended to disable Squid's internal rotation with logfile_rotate 0 in squid.conf and let logrotate handle it exclusively. Configure /etc/logrotate.d/squid to use minimum weekly (7 days) or maximum monthly (1 month) rotation and keep rotate 7 for history. This prevents conflicts between both rotation systems.
|
Squidmon solo lee el archivo access.log actual, no archivos rotados (access.log.0, access.log.1, access.log.gz, etc.). Se recomienda desactivar la rotación interna de Squid con logfile_rotate 0 en squid.conf y dejar que logrotate la maneje exclusivamente. Configure /etc/logrotate.d/squid para usar como mínimo rotación weekly (7 días) o como máximo monthly (1 mes) y mantener rotate 7 para el historial. Esto evita conflictos entre ambos sistemas de rotación.
|
# Disable Squid internal rotation
sudo nano /etc/squid/squid.conf
#  TAG: logfile_rotate
logfile_rotate 0

# Logrotate
sudo sed -i 's/^	daily$/	weekly/' /etc/logrotate.d/squid
# or
sudo sed -i 's/^	daily$/	monthly/' /etc/logrotate.d/squid
# Optional:
sudo sed -i 's/rotate 2/rotate 7/' /etc/logrotate.d/squid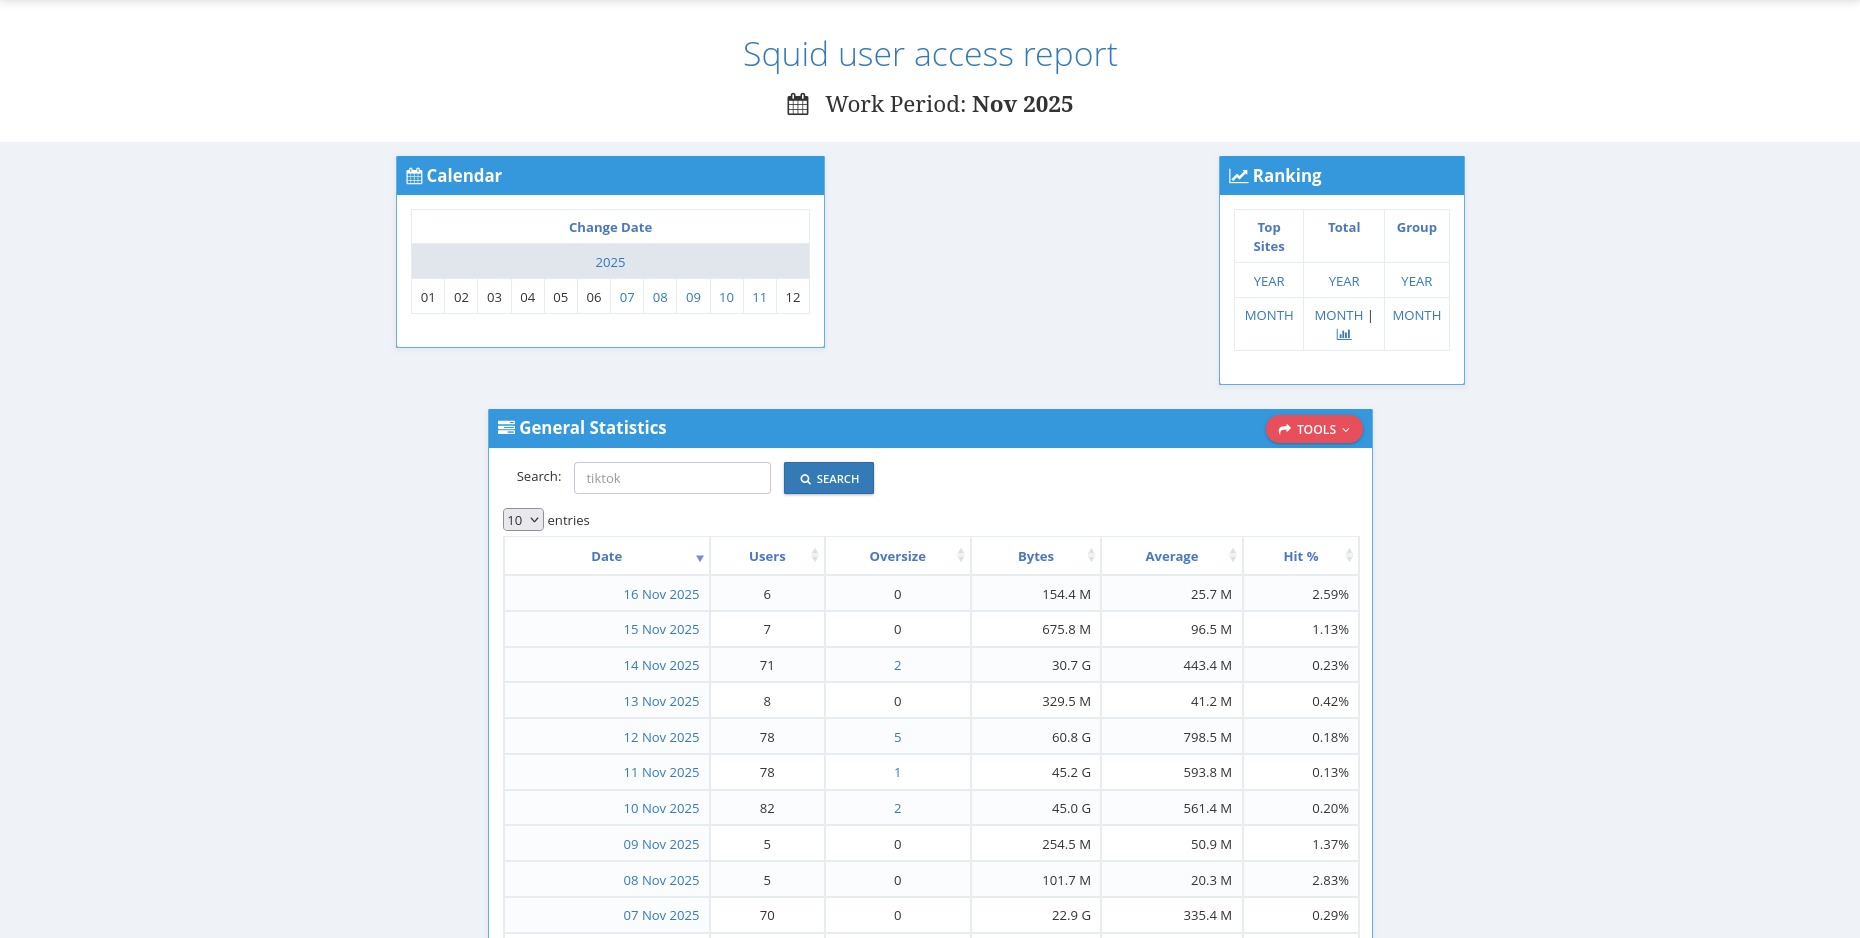
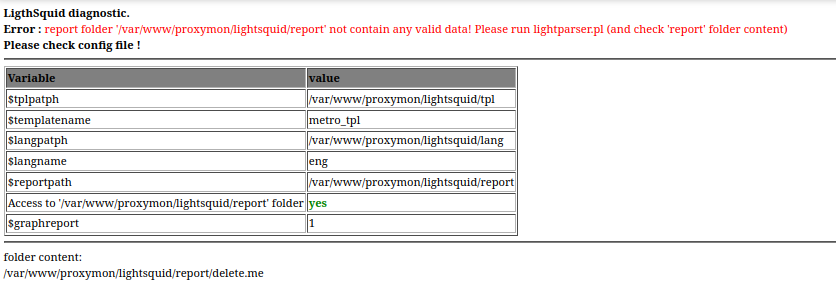
The first time you open Squid Report in your browser, you may receive an error message. This is because you haven't run the script for the first time, or your LAN traffic hasn't passed through Squid, so there's no data in the /var/www/proxymon/lightsquid/report folder. The installation script runs the command that generates the reports, but if they still don't appear, open the terminal and run it manually:
|
La primera vez que abra Squid Report en su navegador, puede salir un mensaje de error. Esto se debe a que no ha ejecutado por primera vez el script o el tráfico de su LAN no ha pasado por Squid y, por tanto, no hay datos en la carpeta /var/www/proxymon/lightsquid/report. El script de instalación ejecuta el comando que genera los reportes, pero si continúan sin aparecer, abra el terminal y ejecute manualmente:
|
sudo /var/www/proxymon/lightsquid/lightparser.pl today
| In the General Statistics module, the search bar allows you to quickly filter and find specific data within the report table. Simply enter a keyword or value in the search field and click the SEARCH button to display matching results. This feature helps you locate information efficiently without scrolling through the entire dataset. | En el módulo General Statistics, la barra de búsqueda te permite filtrar y encontrar datos específicos rápidamente dentro de la tabla de reportes. Simplemente ingresa una palabra clave o valor en el campo de búsqueda y haz clic en el botón SEARCH para mostrar los resultados coincidentes. Esta función te ayuda a localizar información de manera eficiente sin necesidad de desplazarte por todo el conjunto de datos. |
|
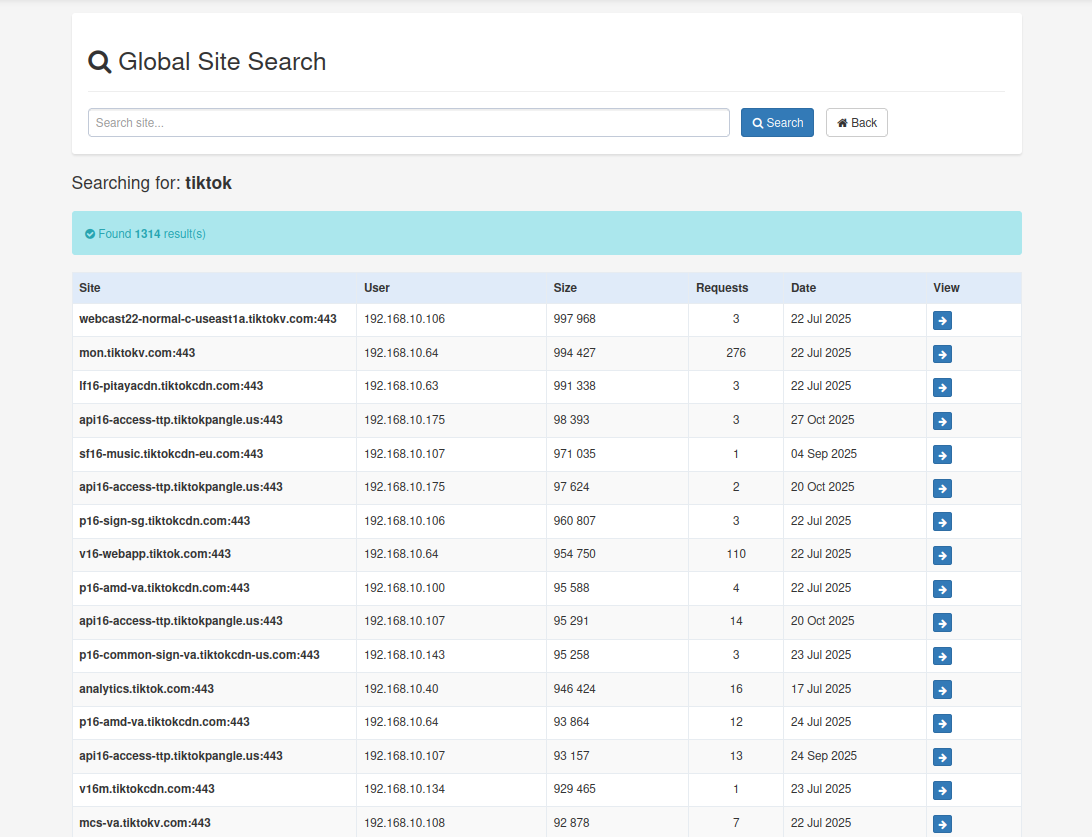
Result: 1,323 entries found in 5.4 seconds. Full-text search across all indexed domains. Data Source: LightSquid reports /var/www/proxymon/lightsquid/report/YYYYMMDD/Search Method: Grep-optimized index with Perl regex fallback Use Case: Historical analysis, domain trends, bandwidth reports |
Resultado: 1,323 registros encontrados en 5.4 s. Búsqueda de texto completo en todos los dominios y sitios indexados. Fuente de Datos: Reportes de LightSquid /var/www/proxymon/lightsquid/report/YYYYMMDD/Método de Búsqueda: Índice optimizado con grep y alternativa de regex Perl Caso de Uso: Análisis histórico, tendencias de dominios, reportes de ancho de banda |
| The installation script adds a task to the crontab to run every 10 minutes. You can change it according to your preferences. | El script de instalación agrega una tarea al crontab para que se ejecute cada 10 minutos. Puedes cambiarla según tus preferencias. |
sudo -u www-data crontab -e
*/10 * * * * /var/www/proxymon/lightsquid/lightparser.pl today|
To add users manually to realname (audit) and skipuser (exclude) lists: Note: Bandata does this automatically. To enable this feature, declare your ACLs in the exclude_acls variable and uncomment the update_lightsquid_realname line at the end of the script.
|
Para agregar usuarios manualmente a las listas realname (auditar) y skipuser (excluir): Nota: Bandata lo hace automáticamente. Para activar esta función, declare sus ACLs en la variable exclude_acls y descomente la línea update_lightsquid_realname al final del script.
|
sudo nano /var/www/proxymon/lightsquid/realname.cfg
# example:
192.168.X.2 Client1
192.168.X.24 Client12
sudo nano /var/www/proxymon/lightsquid/skipuser.cfg
# example:
192.168.X.3 CEO| To exclude users: | Para excluir usuarios: |
sudo nano /var/www/proxymon/lightsquid/skipuser.cfg
# example
192.168.X.1| To scan the devices on your local network, choose any of the following commands along with your network's IP range. e.g.: | Para escanear los dispositivos de su red local, elija cualquiera de estos comandos y el rango de IP de su red. ej: |
# Install required tools
sudo apt install -y nbtscan nmap arp-scan nast sudo netdiscover
# Run the following commands to scan your local network:
# 1. Using nbtscan
sudo nbtscan 192.168.X.0/24
# 2. Using nmap
sudo nmap -sn 192.168.X.0/24
# 3. Using arp-scan
sudo arp-scan --localnet
# 4. Using nast
sudo nast -m
# 5. Using netdiscover
sudo netdiscover| There are only two themes available: "base" (very outdated) and "metro" (default). | Solo hay dos temas disponibles. "base" (muy anticuado) y "metro" (por defecto). |
sudo nano /var/www/proxymon/lightsquid/lightsquid.cfg
#$templatename        ="base";
$templatename        ="metro_tpl";
Traffic statistics are displayed in the web application, along with the users who exceeded their limits. To change the data limit in the lightsquid.cfg statistics:
|
Las estadísticas del tráfico se muestran en la aplicación web, junto con los usuarios que superaron el límite. Para cambiar el límite de datos en las estadísticas de lightsquid.cfg:
|
sudo nano /var/www/proxymon/lightsquid/lightsquid.cfg

# Nomenclature: 10 = 10 MBytes, 512 = 512 Mbytes, 1000 = 1 Gbytes...
# By default it comes in 1000. Do not modify the value 1024.

#user maximum size per day limit (oversize)
$perusertrafficlimit = 1000*1024*1024;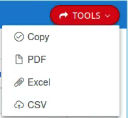
| In the General Statistics module, the Tools button located on the right side of the header provides multiple export options. You can Copy the table data to your clipboard, Print the report directly, or export it in various formats including PDF, Excel (XLSX), and CSV for further analysis and sharing. | En el módulo General Statistics, el botón Tools ubicado en el lado derecho del encabezado ofrece múltiples opciones de exportación. Puedes Copiar los datos de la tabla al portapapeles, Imprimir el reporte directamente, o exportarlo en diversos formatos incluyendo PDF, Excel (XLSX) y CSV para análisis posterior y compartirlo. |
| Squid Report can generate reports in PDF, CSV, and other formats, but it will only display the top domains. If you want to retrieve all the domains visited on your local network in a single ACL suitable for Squid, run the following command: | Squid Report puede generar reportes en PDF, CSV, etc., pero solo mostrará los dominios principales (TOP). Si desea obtener todos los dominios visitados en su red local en una sola ACL apta para Squid, ejecute el siguiente comando: |
find /var/www/proxymon/lightsquid/report -type f -name '[0-9]*.[0-9]*.[0-9]*.[0-9]*' -exec grep -oE '[[:alnum:]_.-]+\.([[:alnum:]_.-]+)+' {} \; | sed 's/^\.//' | sed -r 's/^(www|ftp|ftps|ftpes|sftp|pop|pop3|smtp|imap|http|https)\.//g' | sed -r '/^[0-9]{1,3}(\.[0-9]{1,3}){3}$/d' | tr -d ' ' | awk '{print "." $1}' | sort -u > domains.txt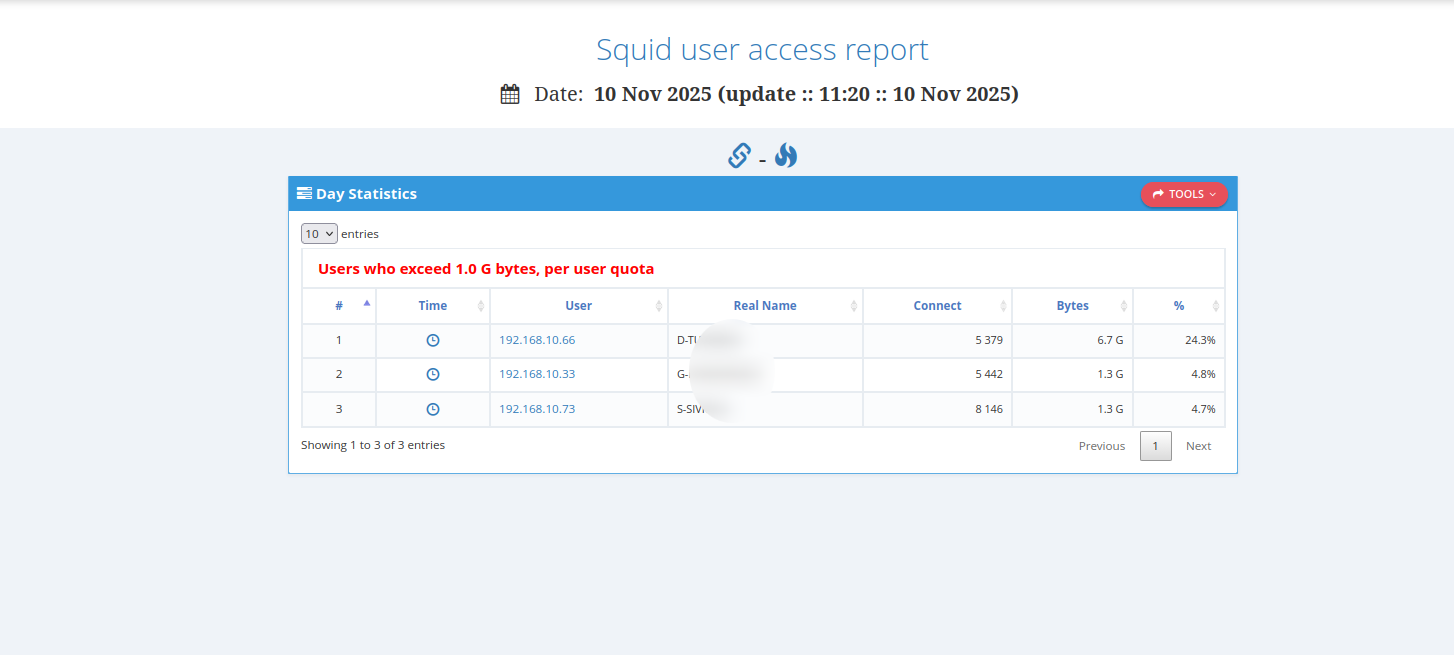
|
Bandata is a script that sets data usage limits —daily, weekly, and monthly— for IP addresses on a LAN monitored with Squid, and automatically blocks those that exceed the established quotas.
Notes:
|
Bandata es un script que establece límites de consumo de datos —diario, semanal y mensual— para direcciones IP de una LAN monitorizada con Squid, y bloquea automáticamente aquellas que superan las cuotas establecidas.
Notas:
|
# Bandata - Monitor bandwidth usage and enforce data limits (every 12 minutes)
sudo crontab -e
*/12 * * * * /var/www/proxymon/tools/bandata.sh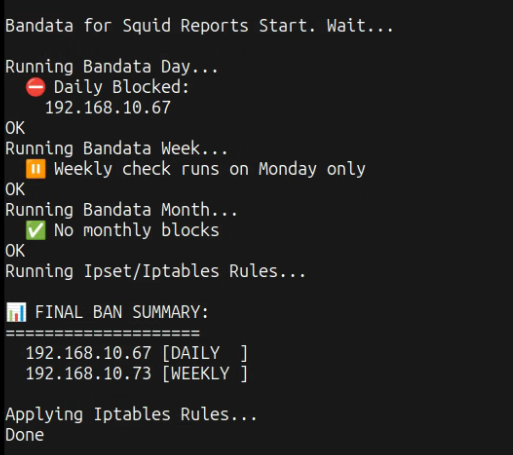
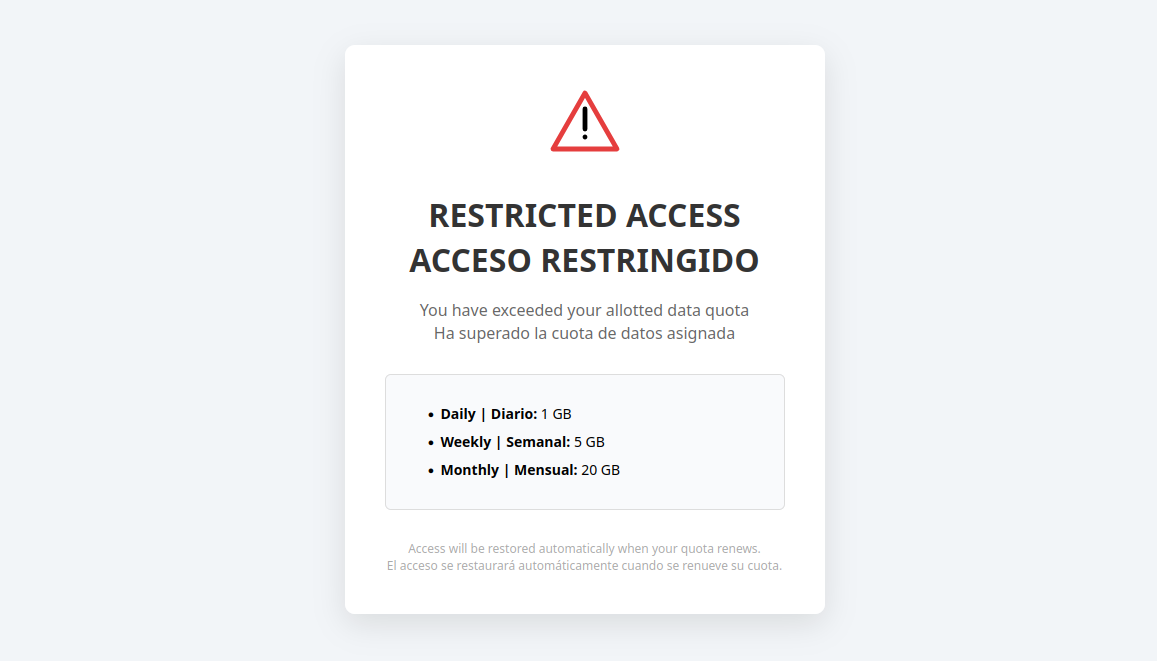
| When a user's IP address exceeds the quota limit -daily, weekly, or monthly- they will be redirected to the Warning portal: | Cuando la IP de un usuario supera el límite de cuota -diaria, semanal o mensual-, será redirigida al portal de advertencia (Warning): |
http://192.168.X.X:18081| To check the banned IPs: | Para verificar las IPs baneadas: |
cat /etc/acl/acl_squid/{banmonth,banweek,banday}.txt | uniq| To set the data limit, you can use GBytes, MBytes, or Bytes; for example: 0.5G, 512M, or 536870912. By default, the data usage limits are: 1 Gigabyte (1G) per day, 5 Gigabytes (5G) per week, and 20 Gigabytes (20G) per month. | Para establecer el límite de datos, puede usar GBytes, MBytes o Bytes; por ejemplo: 0.5G, 512M o 536870912. Por defecto, los valores del límite de consumo son: 1 Gigabyte (1G) diario, 5 Gigabytes (5G) semanales y 20 Gigabytes (20G) mensuales. |
The script checks the current day's Squid Report and blocks any users on the local network who exceed the set consumption limit. The block will be lifted the following day. To change the daily data limit in /var/www/proxymon/tools/bandata.sh:
|
El script verifica el informe del día actual de Squid Report y bloquea a cualquier usuario de la red local que supere el consumo establecido. El bloqueo se levantará al día siguiente. Para cambiar el límite de datos diario en /var/www/proxymon/tools/bandata.sh:
|
max_bandwidth_day="1G"
Every Monday, the script analyzes the bandwidth usage from the weekdays (Monday to Friday) of the previous week. If any local network user exceeds the weekly limit (default: 5G), they will be blocked. To change the weekly data limit in /var/www/proxymon/tools/bandata.sh:
|
Cada lunes, el script analiza el consumo de los días hábiles (lunes a viernes) de la semana anterior. Si un usuario de la red local supera el límite semanal (por defecto 5G), será bloqueado. Para cambiar el límite de datos semanal en /var/www/proxymon/tools/bandata.sh:
|
max_bandwidth_week="5G"
At any time, the script can analyze the accumulated traffic during the weekdays of the current month (excluding weekends). If any user exceeds the monthly limit (default: 20G), they will be blocked immediately. To change the monthly data limit in /var/www/proxymon/tools/bandata.sh:
|
En cualquier momento, el script puede analizar el tráfico acumulado durante los días hábiles del mes actual (excluyendo fines de semana). Si detecta que un usuario ha superado el límite mensual (por defecto 20G), lo bloqueará de inmediato. Para cambiar el límite de datos mensual en /var/www/proxymon/tools/bandata.sh:
|
max_bandwidth_month="20G"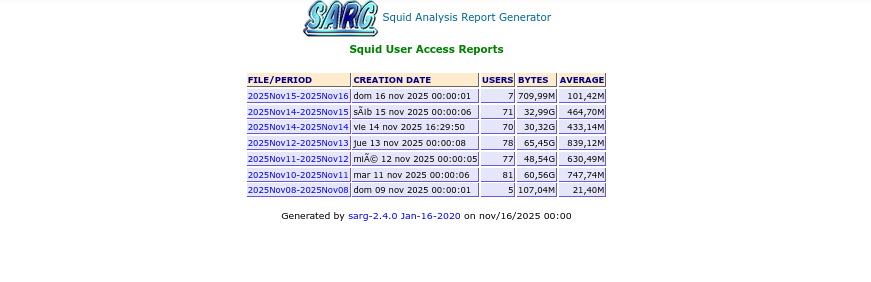
| SARG (Squid Analysis Report Generator) provides detailed analysis of proxy traffic, generating comprehensive reports of user activity, bandwidth consumption, and accessed websites. It tracks connection statistics, data transfer volumes, cache efficiency, and elapsed time for each user or IP address on the network. | SARG (Generador de Reportes de Análisis de Squid) proporciona análisis detallado del tráfico del proxy, generando reportes exhaustivos de la actividad de usuarios, consumo de ancho de banda y sitios web accedidos. Realiza un seguimiento de estadísticas de conexión, volúmenes de transferencia de datos, eficiencia de caché y tiempo transcurrido para cada usuario o dirección IP en la red. |
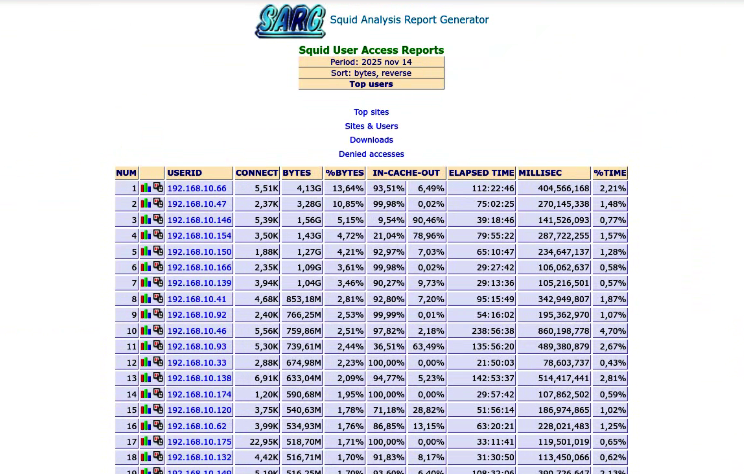
| The Global Report displays aggregated traffic statistics across all users and IP addresses. It shows the top visited websites, total bandwidth usage, connection counts, cache hit rates, and data transfer patterns. This overview helps administrators identify traffic trends, peak usage periods, and overall network behavior patterns. | El Reporte Global muestra estadísticas de tráfico agregadas en todos los usuarios y direcciones IP. Presenta los sitios web más visitados, uso total de ancho de banda, conteos de conexión, tasas de acierto de caché y patrones de transferencia de datos. Esta visión general ayuda a los administradores a identificar tendencias de tráfico, períodos de uso máximo y patrones generales de comportamiento de la red. |
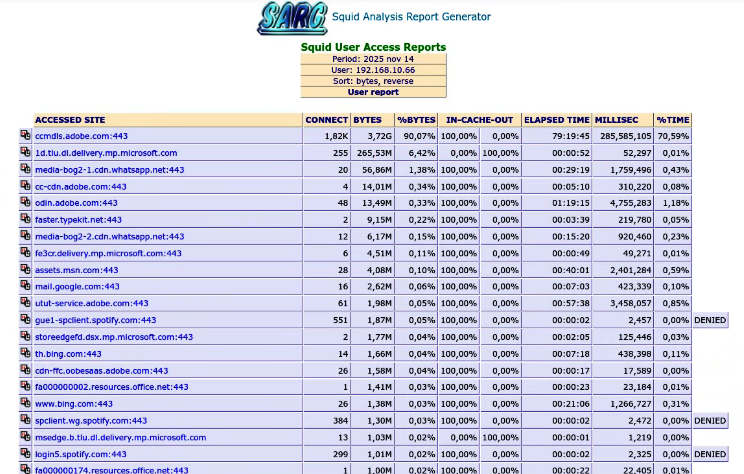
| The IP Report provides granular analysis for individual users or machines. It details specific browsing activity, showing accessed URLs, bandwidth consumption per user, connection frequency, cache efficiency, and time spent online. This enables administrators to monitor individual user behavior and enforce bandwidth policies on specific network devices. | El Reporte por IP proporciona análisis detallado para usuarios o máquinas individuales. Detalla la actividad de navegación específica, mostrando URLs accedidas, consumo de ancho de banda por usuario, frecuencia de conexión, eficiencia de caché y tiempo dedicado en línea. Esto permite a los administradores monitorear el comportamiento de usuarios individuales e implementar políticas de ancho de banda en dispositivos de red específicos. |
SARG only keeps the last 7 days of logs as configured in /etc/sarg/sarg.conf with the parameter lastlog 7. Additionally, a weekly cron job automatically deletes report directories older than 30 days. If you want to change this behavior and extend the retention period (not recommended), modify both the configuration file and the crontab line according to your needs:
|
SARG solo conserva los últimos 7 días de registros según la configuración en /etc/sarg/sarg.conf con el parámetro lastlog 7. Además, una tarea cron semanal elimina automáticamente los directorios de reportes con más de 30 días de antigüedad. Si quiere cambiar este comportamiento y extender el período de retención (no recomendado), modifique tanto el archivo de configuración como la línea de crontab según sus necesidades:
|
# Edit Sarg Config
sudo nano /etc/sarg/sarg.conf
# Change 7 to the desired number of days
lastlog 7
# Edit crontab
sudo -u www-data crontab -l
# Replace: -mtime +30 with the desired number of days
@weekly find /var/www/proxymon/sarg/squid-reports -name "2*" -mtime +30 -type d -exec rm -rf "{}" \; &> /dev/null
# Restart cron
sudo systemctl restart cron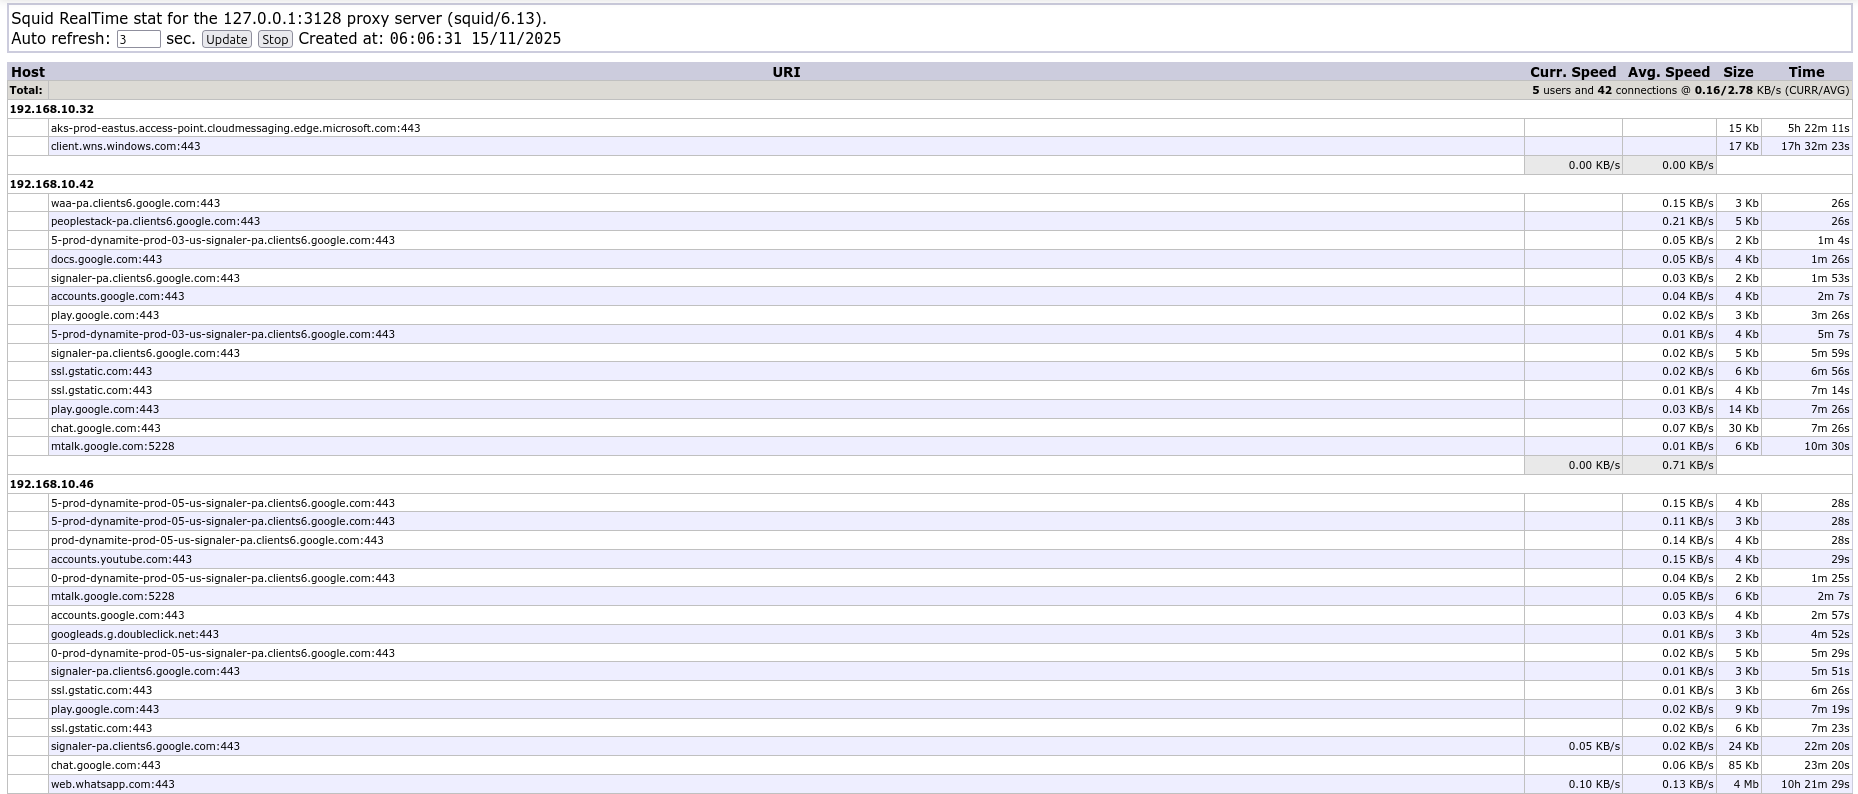
| SqStat is a script that allows you to verify the active connections of users. Use the cachemgr protocol to obtain information about the Squid. | SqStat es un script que permite verificar las conexiones activas de los usuarios. Utiliza el protocolo cachemgr para obtener información de Squid. |
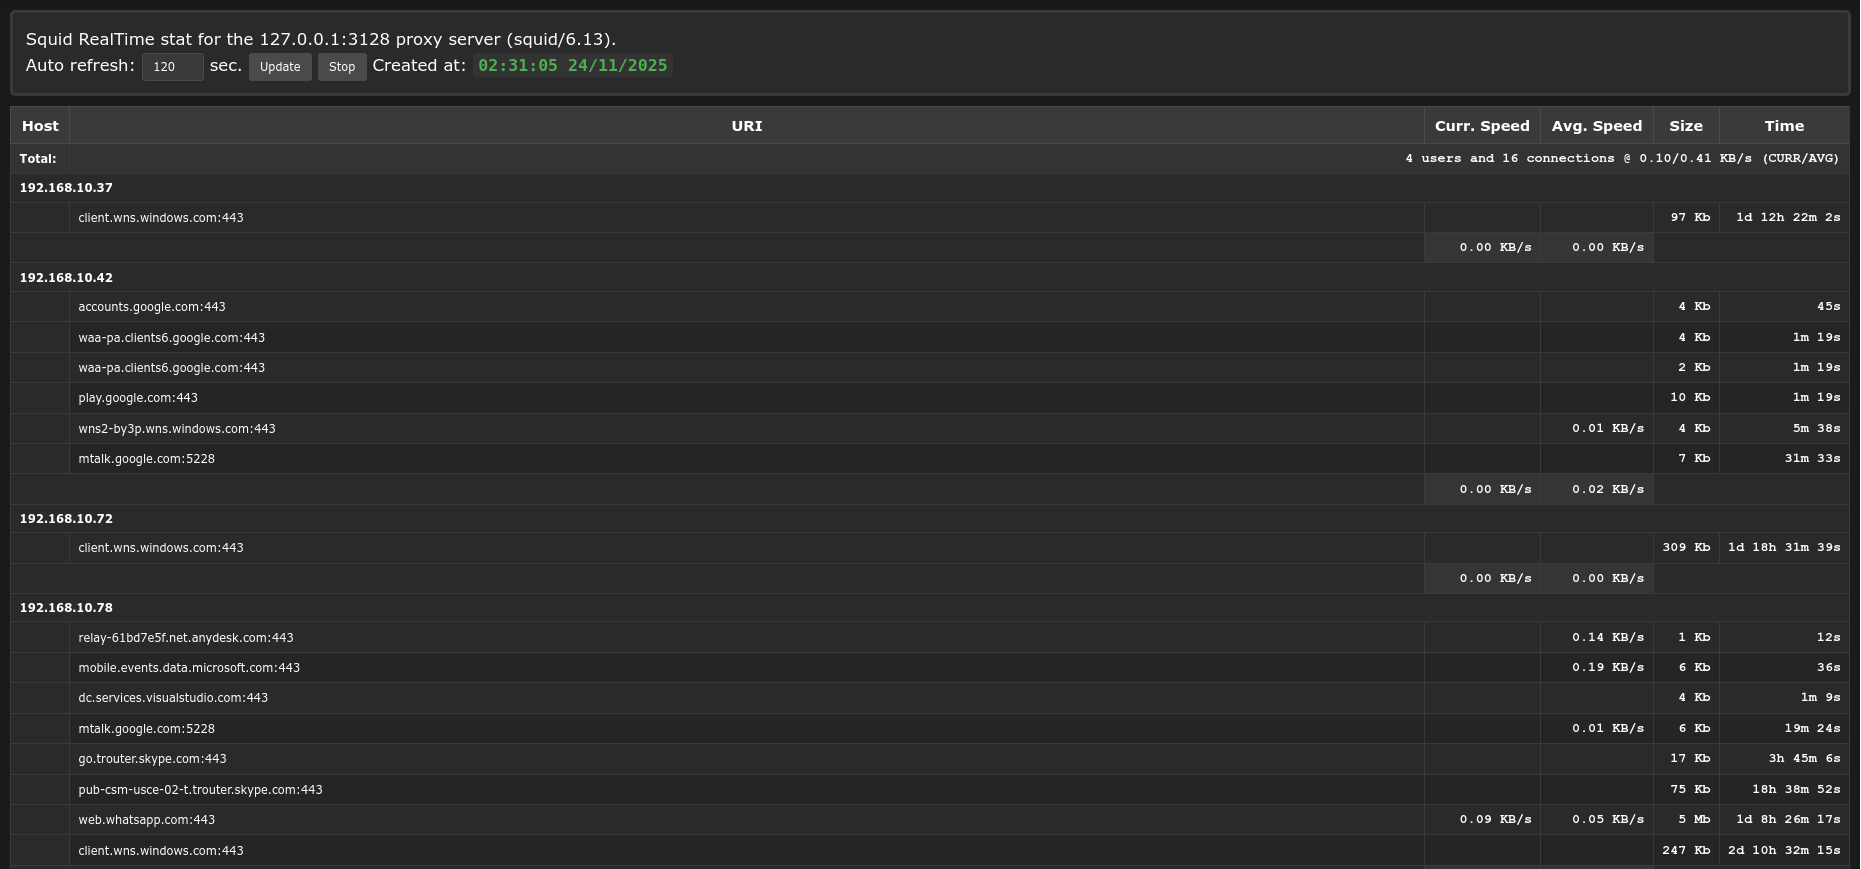
| You can switch between light and dark themes by running the following command: | Puede intercambiar entre tema claro u oscuro, ejecutando el siguiente comando: |
# Dark Theme (Default)
sudo sed -i "s/sqstat\.css/sqstat-dark.css/" /var/www/proxymon/sqstat/sqstat.class.php
# Light Theme (Original)
sudo sed -i "s/sqstat-dark\.css/sqstat.css/" /var/www/proxymon/sqstat/sqstat.class.php
| Select at least 5 seconds: | Seleccione al menos 5 segundos: |

If you have a very large ACL defined in your squid.conf, it is normal for sqstat to temporarily lose its connection and display an error when Squid is restarted or reloaded, because Squid has not yet finished its startup or reload process; just wait a minute or two for the service to stabilize and then press F5 to refresh the page.
|
Si tienes una ACL muy extensa definida en tu squid.conf, es normal que al reiniciar o recargar Squid la interfaz de sqstat pierda temporalmente la conexión y muestre un error, ya que Squid todavía no ha terminado su proceso de arranque o recarga; simplemente espera uno o dos minutos a que el servicio se estabilice y luego presiona F5 para actualizar la página..
|
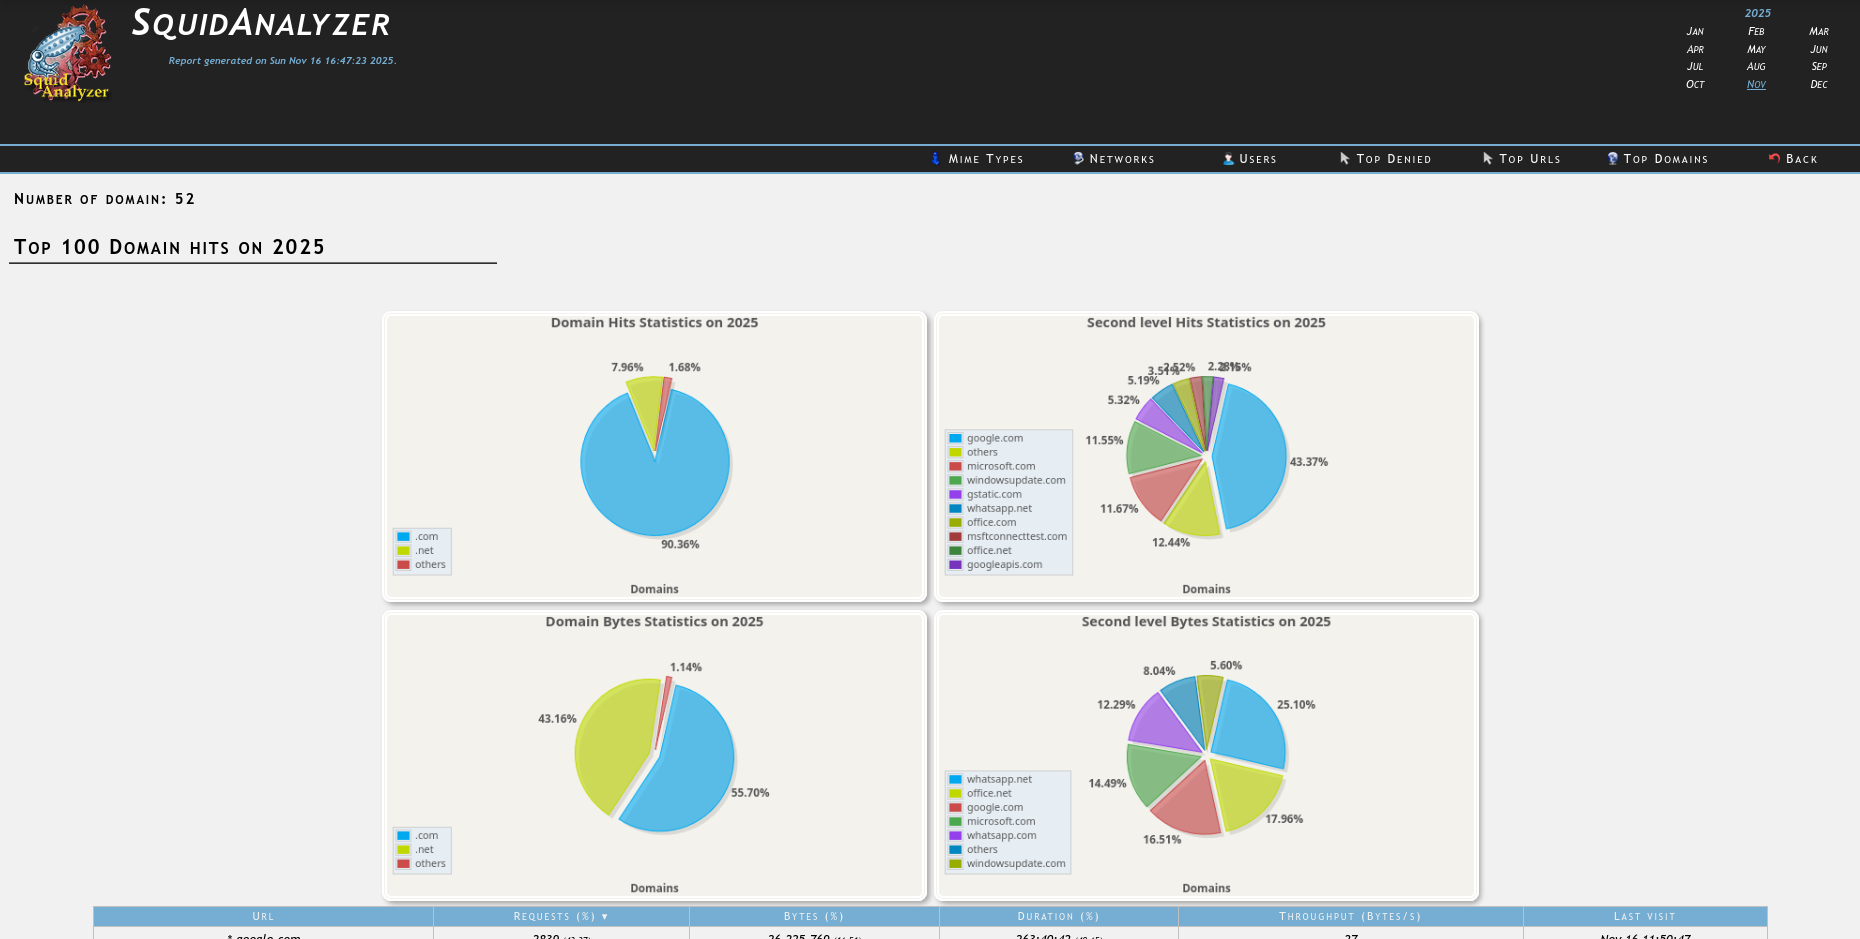
Analyzer is a web-based monitoring tool for real-time analysis of connections and network traffic on the Squid proxy server.
|
Analyzer es una herramienta web de monitoreo para análisis en tiempo real de conexiones y tráfico de red del servidor proxy Squid.
|
| The installation script adds a task to the crontab to run every 10 minutes. You can change it according to your preferences. | El script de instalación agrega una tarea al crontab para que se ejecute todos los días a las 2:00 AM. Puedes cambiarla según tus preferencias. |
sudo -u www-data crontab -e
0 2 * * * cd /var/www/proxymon/squidanalyzer && perl -I. ./squid-analyzer -d > /dev/null 2>&1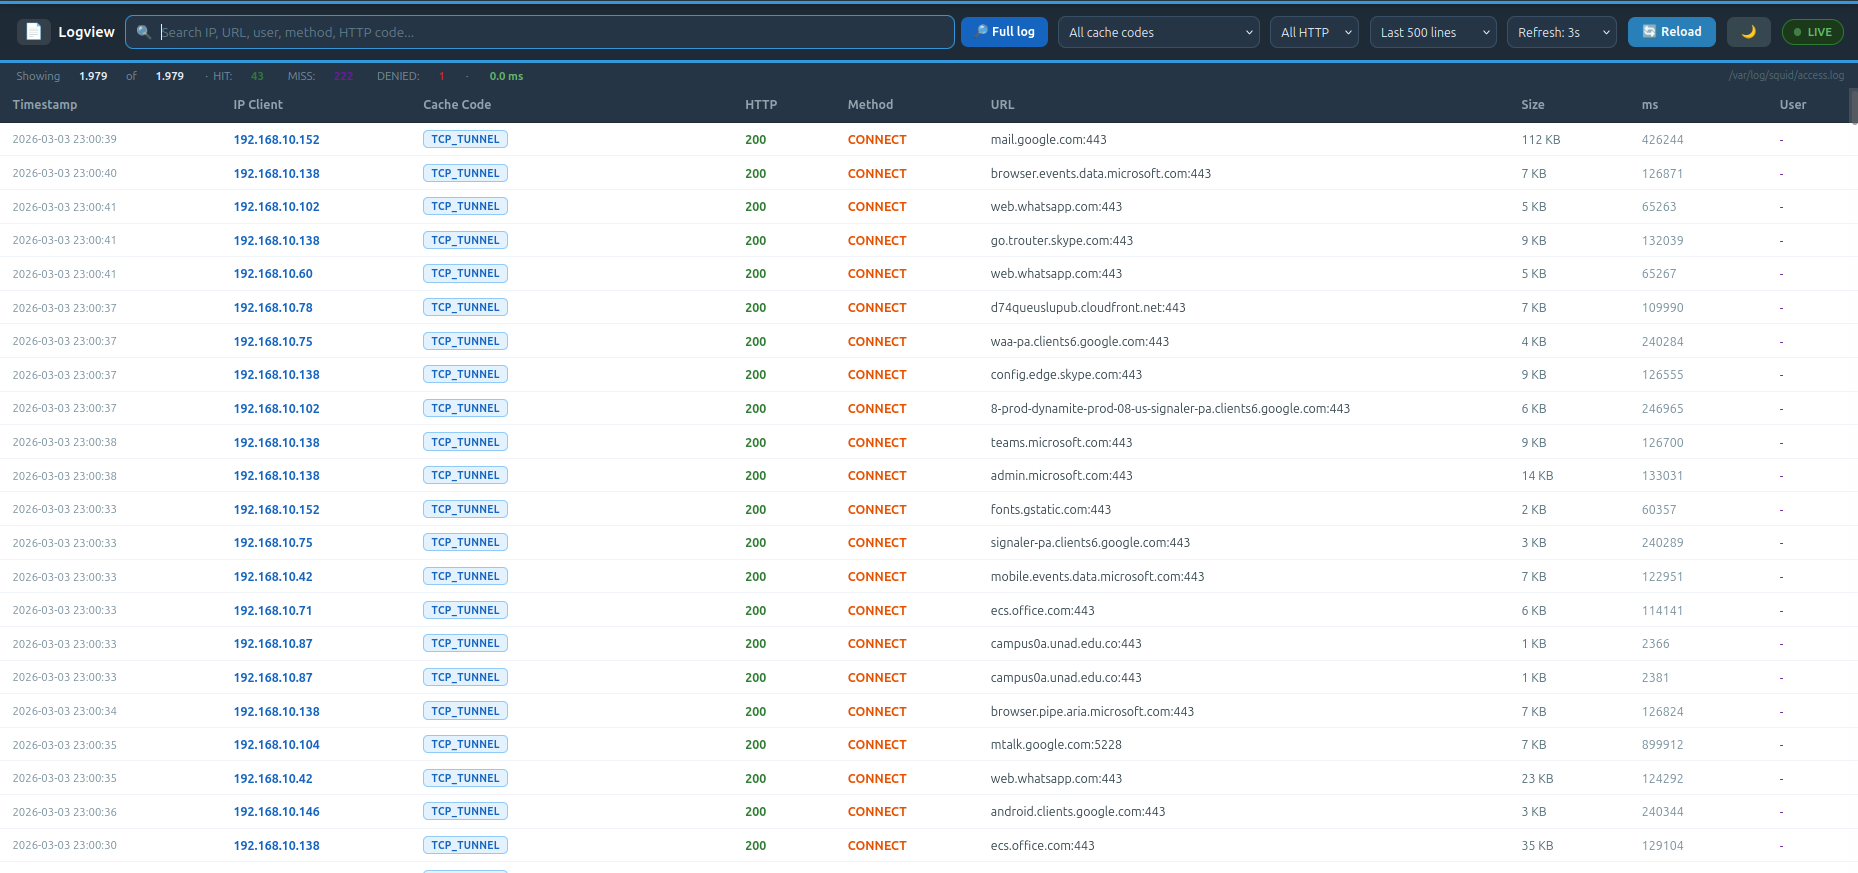
LogView is a real-time Squid proxy log viewer integrated into the Proxy Monitor dashboard. It reads directly from /var/log/squid/access.log, parses each entry into structured fields, and displays them in an interactive table with instant full-text search, combined filters by cache code and HTTP status, column sorting, and automatic polling for new entries without reloading the page. Includes light and dark themes and a configurable refresh interval.
|
LogView es un visor en tiempo real del log del proxy Squid integrado en el panel de Proxy Monitor. Lee directamente desde /var/log/squid/access.log, parsea cada entrada en campos estructurados y los muestra en una tabla interactiva con búsqueda de texto completo instantánea, filtros combinados por cache code y código HTTP, ordenamiento por columnas y polling automático de nuevas entradas sin recargar la página. Incluye temas claro y oscuro e intervalo de refresco configurable.
|

| Message | Description | Descripción |
|---|---|---|
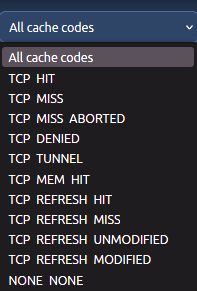 |
Filters by Squid cache code: TCP_HIT (cached), TCP_MISS (origin), TCP_MISS_ABORTED (aborted), TCP_DENIED (blocked), TCP_TUNNEL (HTTPS), TCP_MEM_HIT (memory cache), TCP_REFRESH_HIT/MISS (revalidated), TCP_REFRESH_UNMODIFIED/MODIFIED (revalidation result), NONE_NONE (invalid/error request). | Filtra por código de caché de Squid: TCP_HIT (caché), TCP_MISS (origen), TCP_MISS_ABORTED (abortado), TCP_DENIED (bloqueado), TCP_TUNNEL (HTTPS), TCP_MEM_HIT (memoria), TCP_REFRESH_HIT/MISS (revalidado), TCP_REFRESH_UNMODIFIED/MODIFIED (resultado de revalidación), NONE_NONE (solicitud inválida/error). |
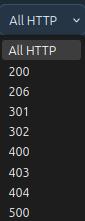 |
Filters by HTTP response code: 200, 206, 301, 302, 400, 403, 404, 500. Color-coded: green (2xx), yellow (3xx), red (4xx/5xx). | Filtra por código de respuesta HTTP: 200, 206, 301, 302, 400, 403, 404, 500. Codificado por color: verde (2xx), amarillo (3xx), rojo (4xx/5xx). |
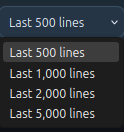 |
Number of lines loaded from access.log on startup: 500, 1,000, 2,000, or 5,000. | Número de líneas cargadas desde access.log al inicio: 500, 1.000, 2.000 o 5.000. |
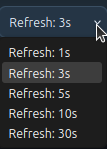 |
Polling interval for new entries: 1s, 3s (default), 5s, 10s, or 30s. | Intervalo de sondeo para nuevas entradas: 1s, 3s (por defecto), 5s, 10s o 30s. |
 |
Live mode active. LogView polls access.log automatically and prepends new rows with a green animation. | Modo en vivo activo. LogView sondea el access.log automáticamente y agrega nuevas filas con animación verde. |
 |
Polling suspended. Indicator turns red and shows PAUSED. Click again to resume. | Sondeo suspendido. El indicador cambia a rojo y muestra PAUSED. Haga clic nuevamente para reanudar. |
 |
Dark Mode button. | Boton para Modo Oscuro. |
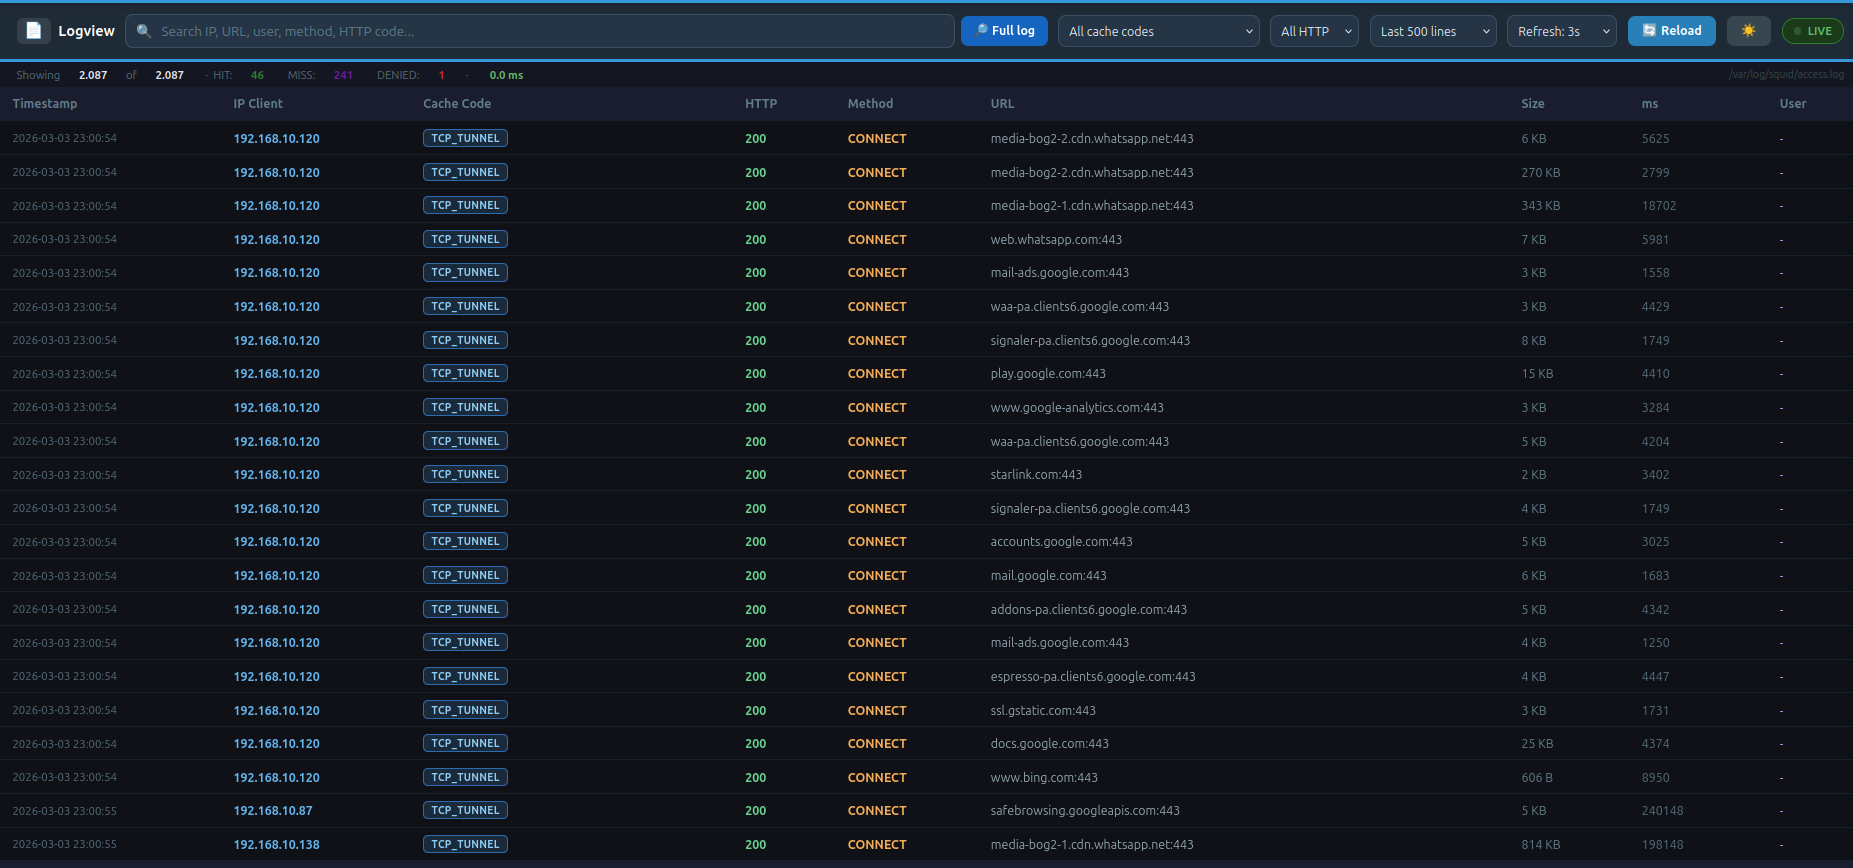
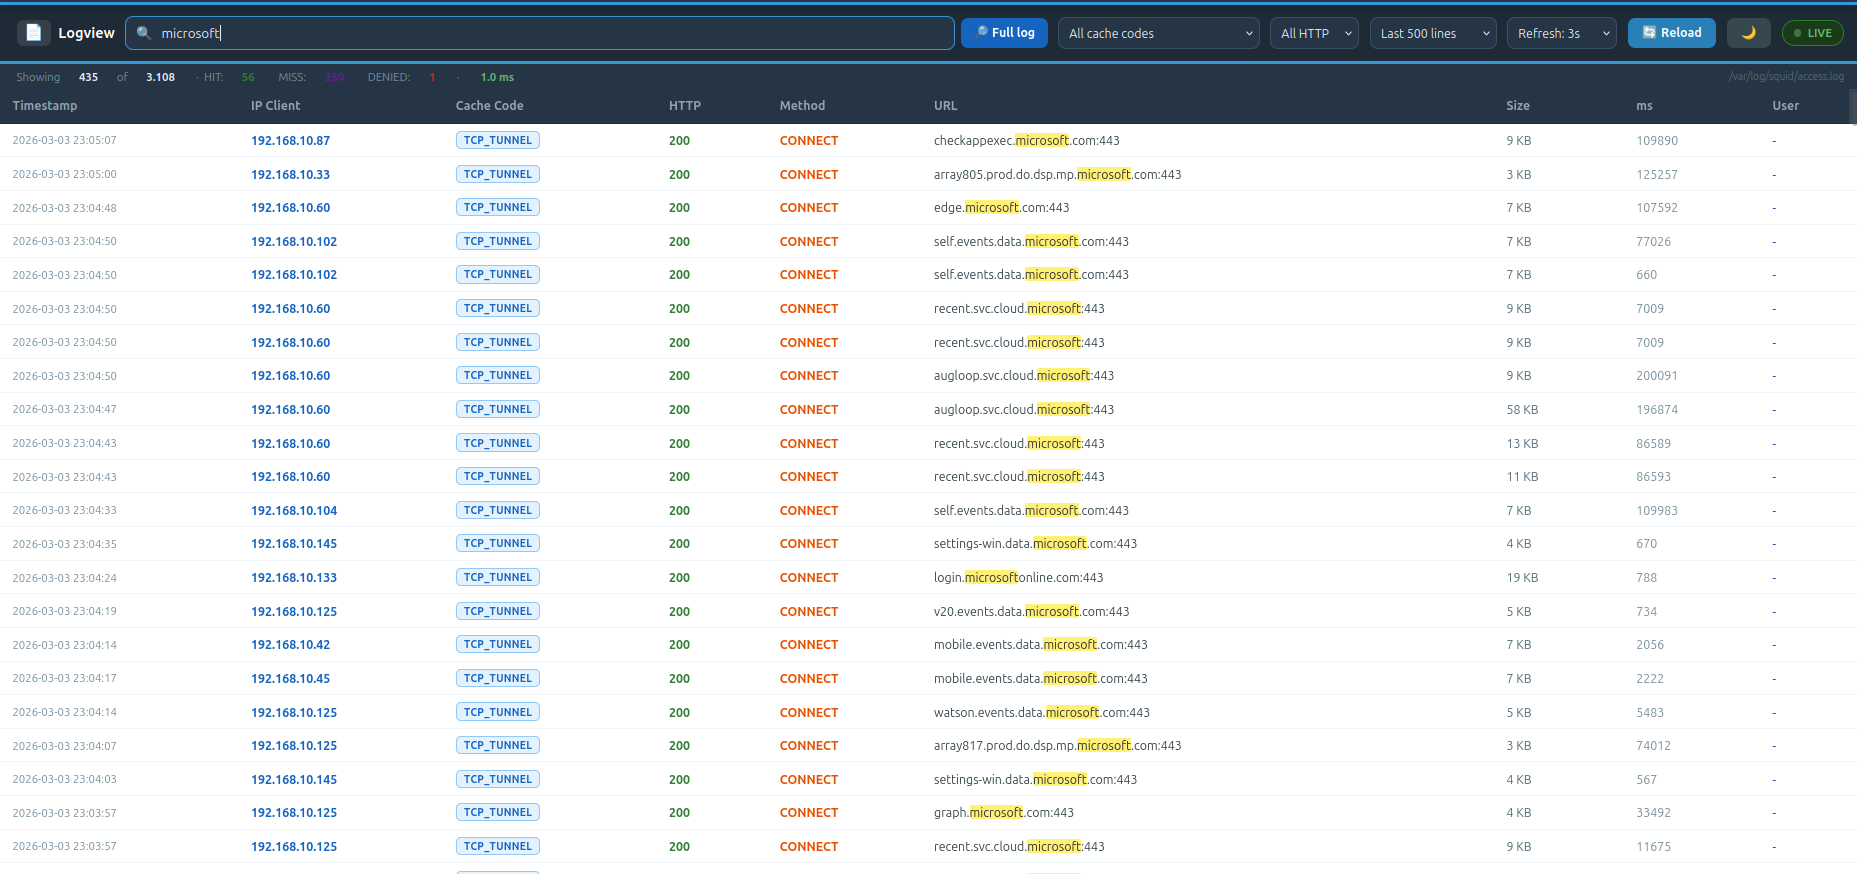
| Search bar. Filters loaded entries in real time by IP, URL, user, HTTP method, cache or response code. | Barra de búsqueda. Filtra las entradas cargadas en tiempo real por IP, URL, usuario, método HTTP, caché o código de respuesta. |
| Message | Description | Descripción |
|---|---|---|
 |
Click to activate full log search mode. | Púlselo para activar el modo de búsqueda completa del log. |
 |
Click to return to live view. | Púlselo para regresar a la vista en tiempo real. |
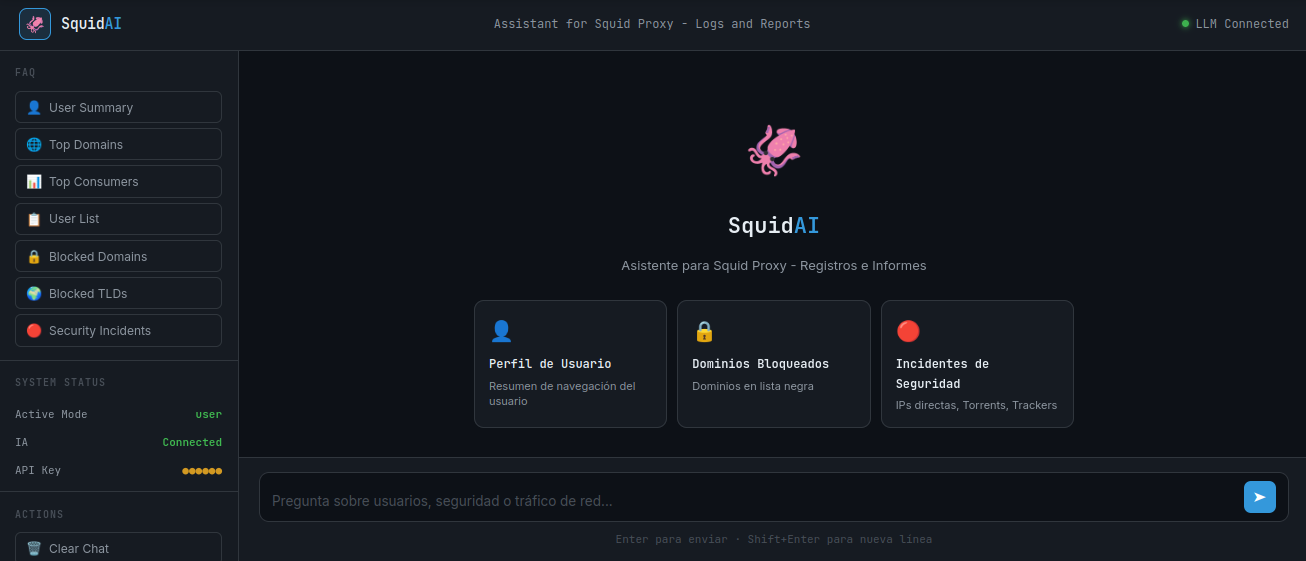
SquidAI is a domain-specific conversational assistant (ANI) for network administrators, based on a hybrid RAG architecture that employs in-memory BM25 lexical retrieval and generation via an external LLM API. It analyzes logs from Squid Proxy, LightSquid reports, and ACLs, combining deterministic responses with natural language generation to provide detailed reports on:
|
SquidAI es un asistente conversacional de dominio específico (ANI) para administradores de red, basado en una arquitectura RAG híbrida que emplea recuperación léxica BM25 en memoria y generación mediante un LLM externo vía API. Analiza logs de Squid Proxy, reportes de LightSquid y ACLs, combinando respuestas deterministas con generación en lenguaje natural para proporcionar reportes detallados sobre:
|
|
User queries: "Show me JOHN-SMITH activity" "What did CARLOS-GARCIA do today?" "Report for ACCOUNTING-DEPT" |
Consultas de usuario: "Muéstrame la actividad de JOHN-SMITH" "¿Qué hizo CARLOS-GARCIA hoy?" "Reporte de CONTABILIDAD" |
|
Network queries: "Top 10 most visited domains today" "Who consumes the most bandwidth?" "Users who exceeded 3 GB" |
Consultas de red: "Top 10 dominios más visitados hoy" "¿Quién consume más ancho de banda?" "Usuarios que superaron 3 GB" |
|
Security queries: "Are there security incidents?" "Detect any threat today?" "Is there torrent traffic?" |
Consultas de seguridad: "¿Hay incidentes de seguridad?" "¿Detectas alguna amenaza hoy?" "¿Hay tráfico de torrents?" |
|
Blocked accesses: "Which IPs accessed blocked domains?" "Show blocked TLD accesses" |
Accesos bloqueados: "¿Qué IPs accedieron a dominios bloqueados?" "Muestra accesos a TLDs bloqueados" |
|
User list: "List all registered users" "Show me all users" |
Lista de usuarios: "Lista todos los usuarios registrados" "Muéstrame todos los usuarios" |
Note: The user names in the examples are illustrative. For the assistant to recognize them, they must exist in
realname.cfg(and not be excluded inskipuser.cfg), where LightSquid stores the IP/Hostname mapping.Nota: Los nombres de usuario en los ejemplos son ilustrativos. Para que el asistente los reconozca, deben existir en
realname.cfg(y no estar excluidos enskipuser.cfg), donde LightSquid almacena el mapeo de IP/Hostname.
/etc/acl/acl_squid/blockpatterns.txt and direct IPv4 detection. The severity classification (CRITICAL, HIGH, MEDIUM) is calculated based on hit frequency.
|
/etc/acl/acl_squid/blockpatterns.txt y detección de IPv4 directa. La clasificación de severidad (CRITICAL, HIGH, MEDIUM) se calcula en base a la frecuencia de hits.
|
🔧 API Setup: SquidAI requires an LLM provider to function. The configuration file is located outside the webroot for security:
/etc/proxymon/ contains two files: .env (SquidAI LLM credentials) and proxymon.env (Bandata network and quota settings). Do not confuse them.
Set your provider URL, API key and response format:
…/accounts/ACCOUNT_ID/ai/run/MODEL_NAME), others use a fixed URL with the model in LLM_MODEL (e.g. OpenAI, Groq), and others embed the API key as a URL parameter (e.g. Gemini: …?key=YOUR_KEY). Check the commented examples in the .env file for each provider's exact format. Leave LLM_MODEL empty if the model is already part of the URL.
LLM_RESPONSE_FORMAT tells the worker how to read the response: openai (most providers), ollama (local Ollama), or gemini (Google Gemini passthrough).
The file includes commented examples for: Cloudflare Workers AI, OpenAI, Groq, OpenRouter, Together AI, Ollama (local), LM Studio (local) and Google Gemini. Uncomment one block and fill in your credentials. 🔒 Security: The .env file is stored in /etc/proxymon/, outside the Apache webroot. Permissions are set to 640 (root:www-data) so only PHP can read it.
🔄 Rate Limits & Retries: LLM APIs may experience congestion depending on demand. SquidAI implements an automatic retry mechanism: up to 4 attempts with progressive delays (4s, 8s, 15s) before giving up. If the API is temporarily unavailable, the assistant will display retry messages. After all attempts fail, it will show a message (check table). 🔌 LLM Status: The connection indicator shows three states: Checking (yellow), Connected (green), and Offline (red) (check table). |
🔧 Configuración de API: SquidAI requiere un proveedor LLM para funcionar. El archivo de configuración se encuentra fuera del webroot por seguridad:
/etc/proxymon/ contiene dos archivos: .env (credenciales LLM de SquidAI) y proxymon.env (configuración de red y cuotas de Bandata). No los confunda.
Configure la URL del proveedor, la API key y el formato de respuesta:
…/accounts/ACCOUNT_ID/ai/run/NOMBRE_MODELO), otros usan una URL fija con el modelo en LLM_MODEL (ej: OpenAI, Groq), y otros insertan la API key como parámetro en la URL (ej: Gemini: …?key=SU_KEY). Consulte los ejemplos comentados en el archivo .env para el formato exacto de cada proveedor. Deje LLM_MODEL vacío si el modelo ya forma parte de la URL.
LLM_RESPONSE_FORMAT indica al worker cómo leer la respuesta: openai (la mayoría de proveedores), ollama (Ollama local) o gemini (Google Gemini passthrough).
El archivo incluye ejemplos comentados para: Cloudflare Workers AI, OpenAI, Groq, OpenRouter, Together AI, Ollama (local), LM Studio (local) y Google Gemini. Descomente un bloque y complete sus credenciales. 🔒 Seguridad: El archivo .env se almacena en /etc/proxymon/, fuera del webroot de Apache. Los permisos son 640 (root:www-data) para que solo PHP pueda leerlo.
🔄 Límites de tasa y reintentos: Las APIs LLM pueden experimentar congestión según la demanda. SquidAI implementa un mecanismo de reintento automático: hasta 4 intentos con retardos progresivos (4s, 8s, 15s) antes de desistir. Si la API no está disponible temporalmente, el asistente mostrará mensajes de reintento y al finalizar mostrará un mensaje (ver tabla). 🔌 Estado LLM: El indicador de conexión muestra tres estados: Checking (amarillo), Connected (verde) y Offline (rojo) (ver tabla). |
| Message | Description | Descripción |
|---|---|---|
 |
Example of the automatic retry message. | Ejemplo del mensaje de reintento automático. |
 |
API Down Example. | Ejemplo de API caída. |
| 🔌 LLM Status: The connection indicator shows three states: Checking (yellow), Connected (green), and Offline (red) (check table). | 🔌 Estado LLM: El indicador de conexión muestra tres estados: Checking (amarillo), Connected (verde) y Offline (rojo) (ver tabla). |
| Message | Description | Descripción |
|---|---|---|
 |
Checking LLM connection | Verificando conexión con el LLM |
 |
LLM connected and ready | LLM conectado y listo |
 |
LLM unreachable or offline | LLM inaccesible o fuera de línea |
/var/log/apache2/proxymon_access.log
/var/log/apache2/proxymon_error.log
/var/log/bandata.log| This project incorporates and enhances components from multiple sources, building upon their legacies after discontinuation or stagnation. The details of the original projects are described below: | Este proyecto incorpora y mejora componentes de múltiples fuentes, continuando su legado tras su descontinuación o estancamiento. Los detalles de los proyectos originales se describen a continuación: |
| Project / Developer | Last Official Version | Unofficial Update | Additional |
|---|---|---|---|
| LightSquid | v1.8-7 (2009) | v1.8.1 (2021) | Metro_tpl (2020) |
| SARG | v2.4.0 (2020-01-16) | N/A | N/A |
| Sqstat - Alex Samorukov | v1.20 (2006) | N/A | N/A |
| SquidAnalyzer github | v6.6 (2017) | N/A | N/A |
| This project is designed to run locally and be accessed over a LAN. It is not recommended to expose it to the internet, as it lacks the hardening required for public-facing deployments. If you choose to publish it despite this warning, it is strongly recommended to do so through an on-demand tunnel rather than opening ports directly. This approach lets you start and stop public access at will, without permanently exposing your server. | Este proyecto está diseñado para ejecutarse localmente y ser accedido en red LAN. No se recomienda exponerlo a internet, ya que no cuenta con el endurecimiento necesario para despliegues públicos. Si decide publicarlo a pesar de esta advertencia, se recomienda hacerlo a través de un túnel bajo demanda en lugar de abrir puertos directamente. Este enfoque le permite iniciar y detener el acceso público a voluntad, sin exponer el servidor de forma permanente. |
Optional tunnel:
This repository
|
Este repositorio
|

| This project uses a dual-licensing model to balance software freedom with content protection: | Este proyecto utiliza un modelo de licencia dual para equilibrar la libertad del software con la protección del contenido: |
| Content | Licensed Under |
|---|---|
| Scripts, Binaries, Infrastructure |  |
| RAG, Workers, Specialized Modules, Docs |  |
THE SOFTWARE IS PROVIDED "AS IS", WITHOUT WARRANTY OF ANY KIND, EXPRESS OR IMPLIED, INCLUDING BUT NOT LIMITED TO THE WARRANTIES OF MERCHANTABILITY, FITNESS FOR A PARTICULAR PURPOSE AND NONINFRINGEMENT. IN NO EVENT SHALL THE AUTHORS OR COPYRIGHT HOLDERS BE LIABLE FOR ANY CLAIM, DAMAGES OR OTHER LIABILITY, WHETHER IN AN ACTION OF CONTRACT, TORT OR OTHERWISE, ARISING FROM, OUT OF OR IN CONNECTION WITH THE SOFTWARE OR THE USE OR OTHER DEALINGS IN THE SOFTWARE.